Where do immigrants live in Montréal and Québec City?
A recent by Arthur Charpentier (@freakonometrics) has inspired me to finally give Jens von Bergmann’s (@vb_jens) dotdensity package a run.
I will come back to this code for some examples of how to use dotdensity but also for rmapzen road and water tiles.
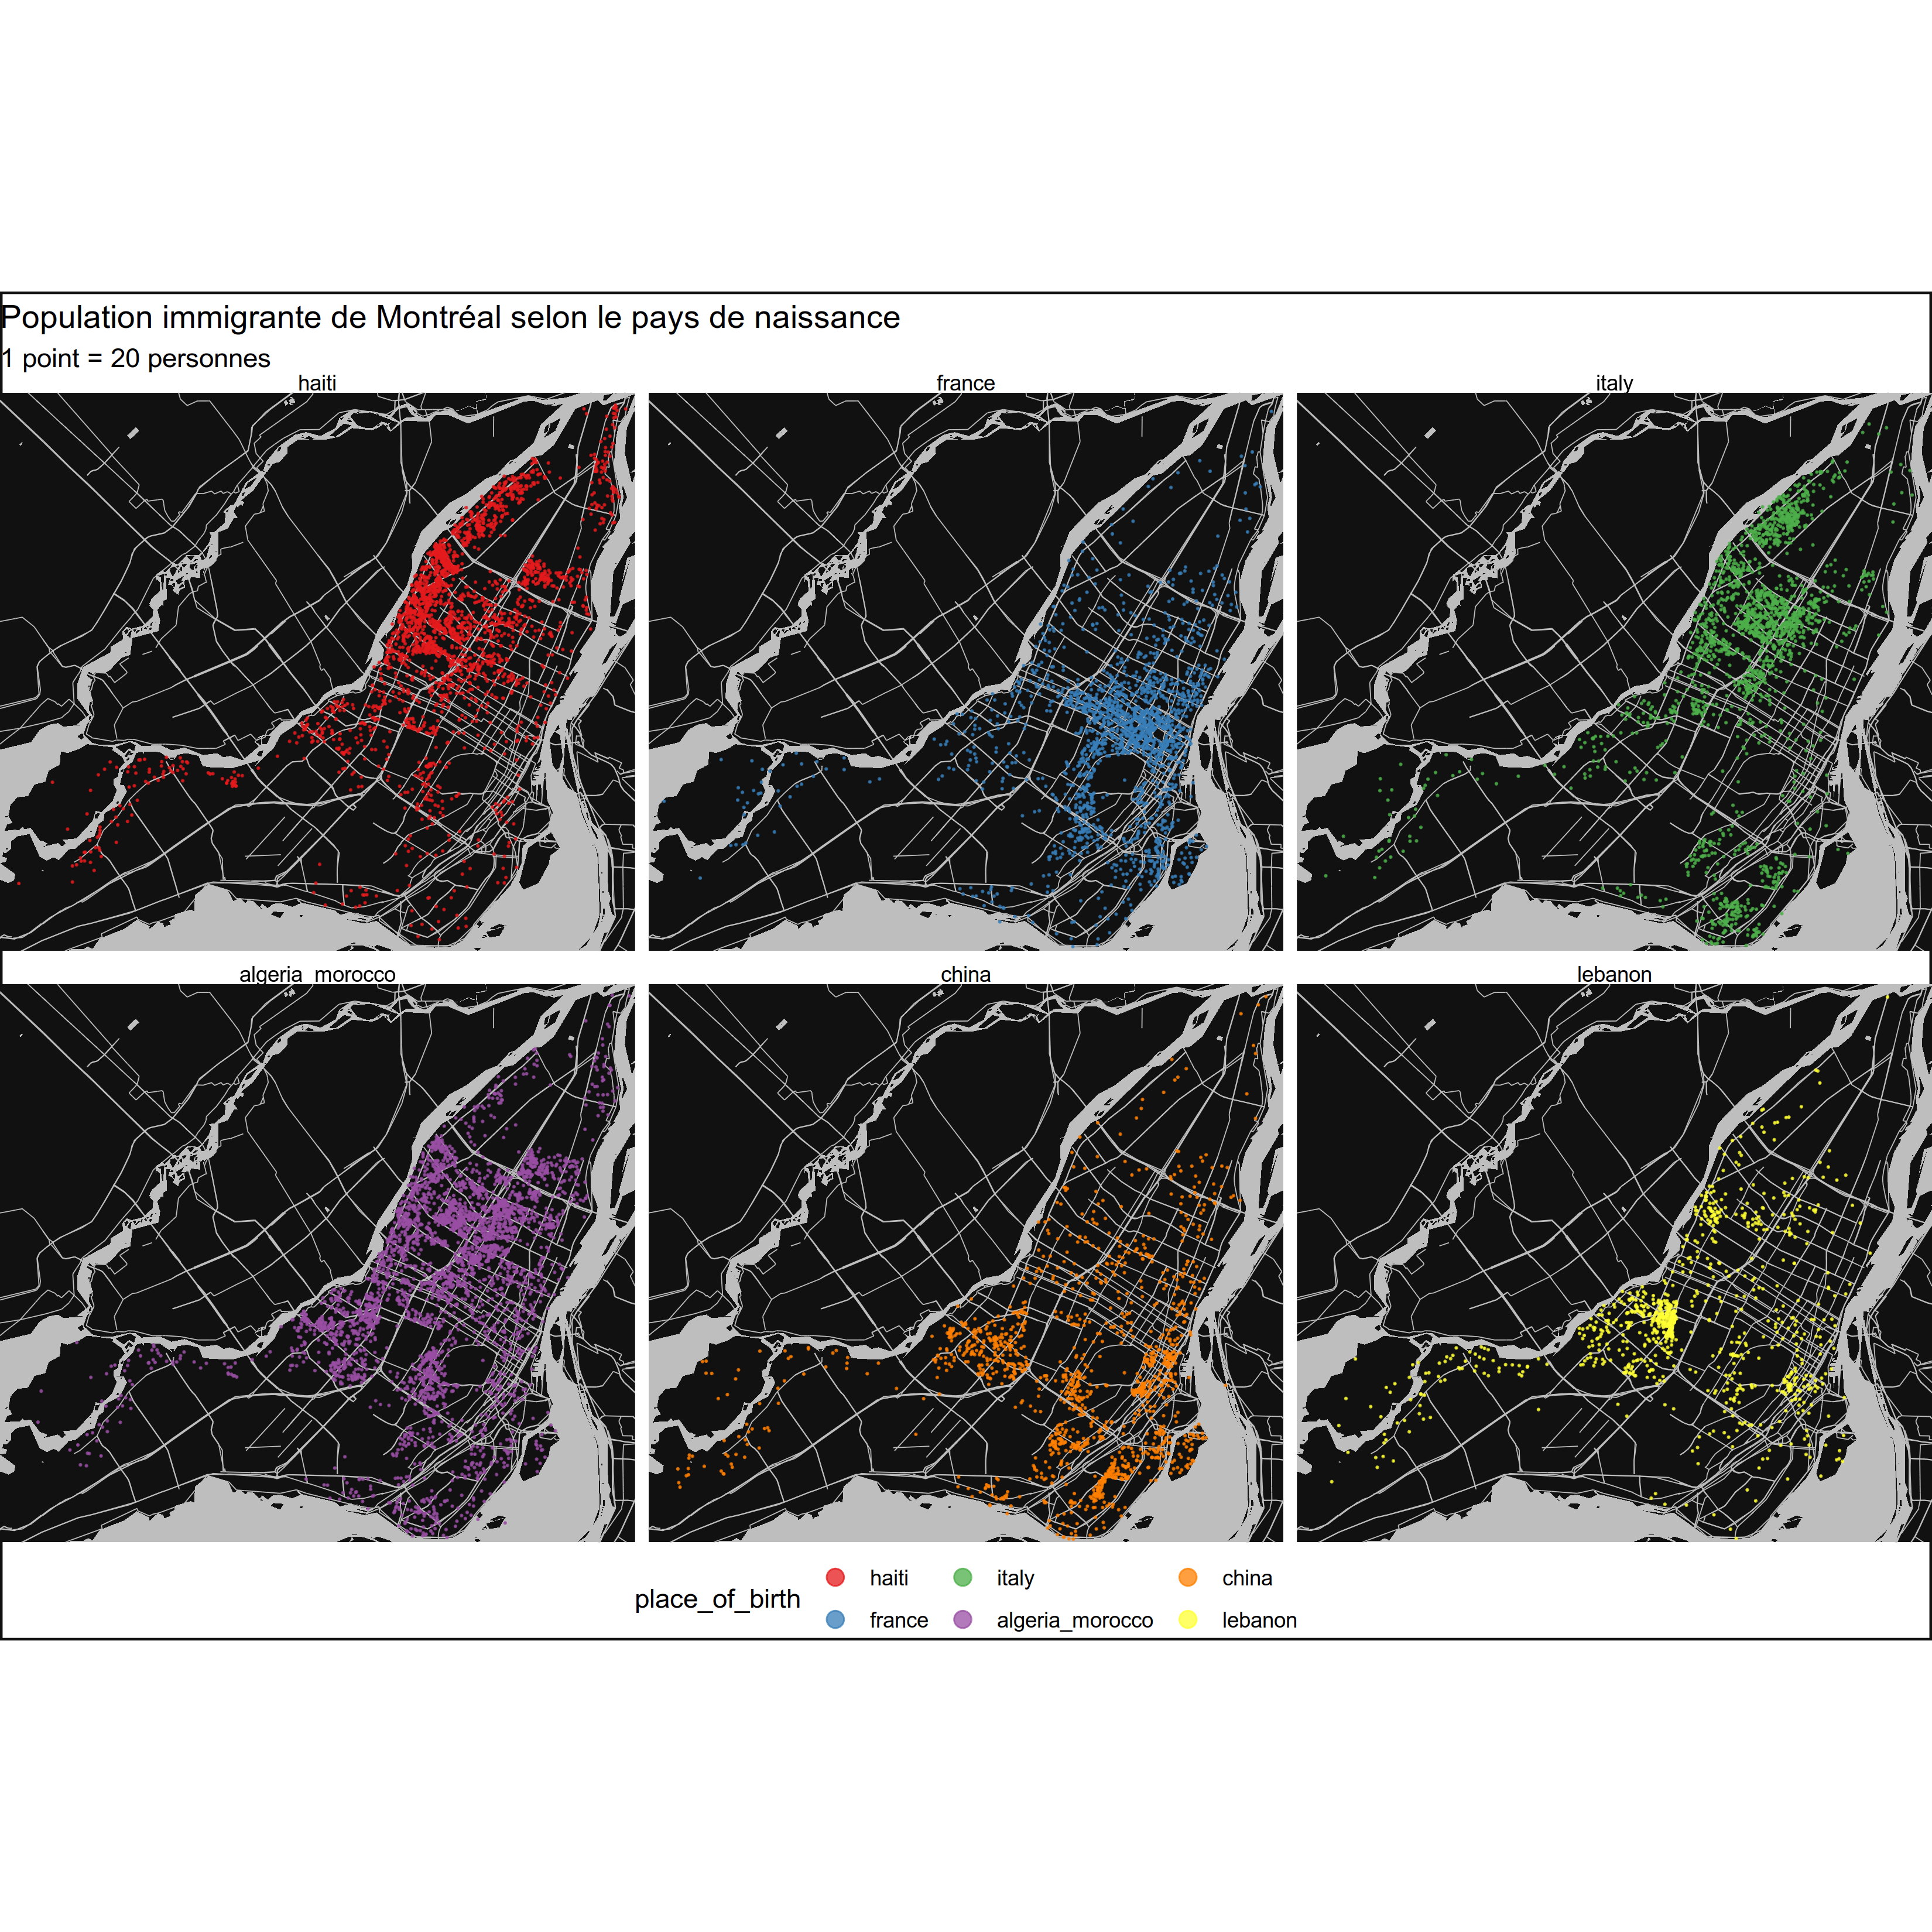
At first glance, it appears that the immigrants in Montréal from France, Italy, China and Lebanon won’t run into each other very often. Immigrants from Haiti and Algeria and Morocco and both more likely to be found in the North of the island.
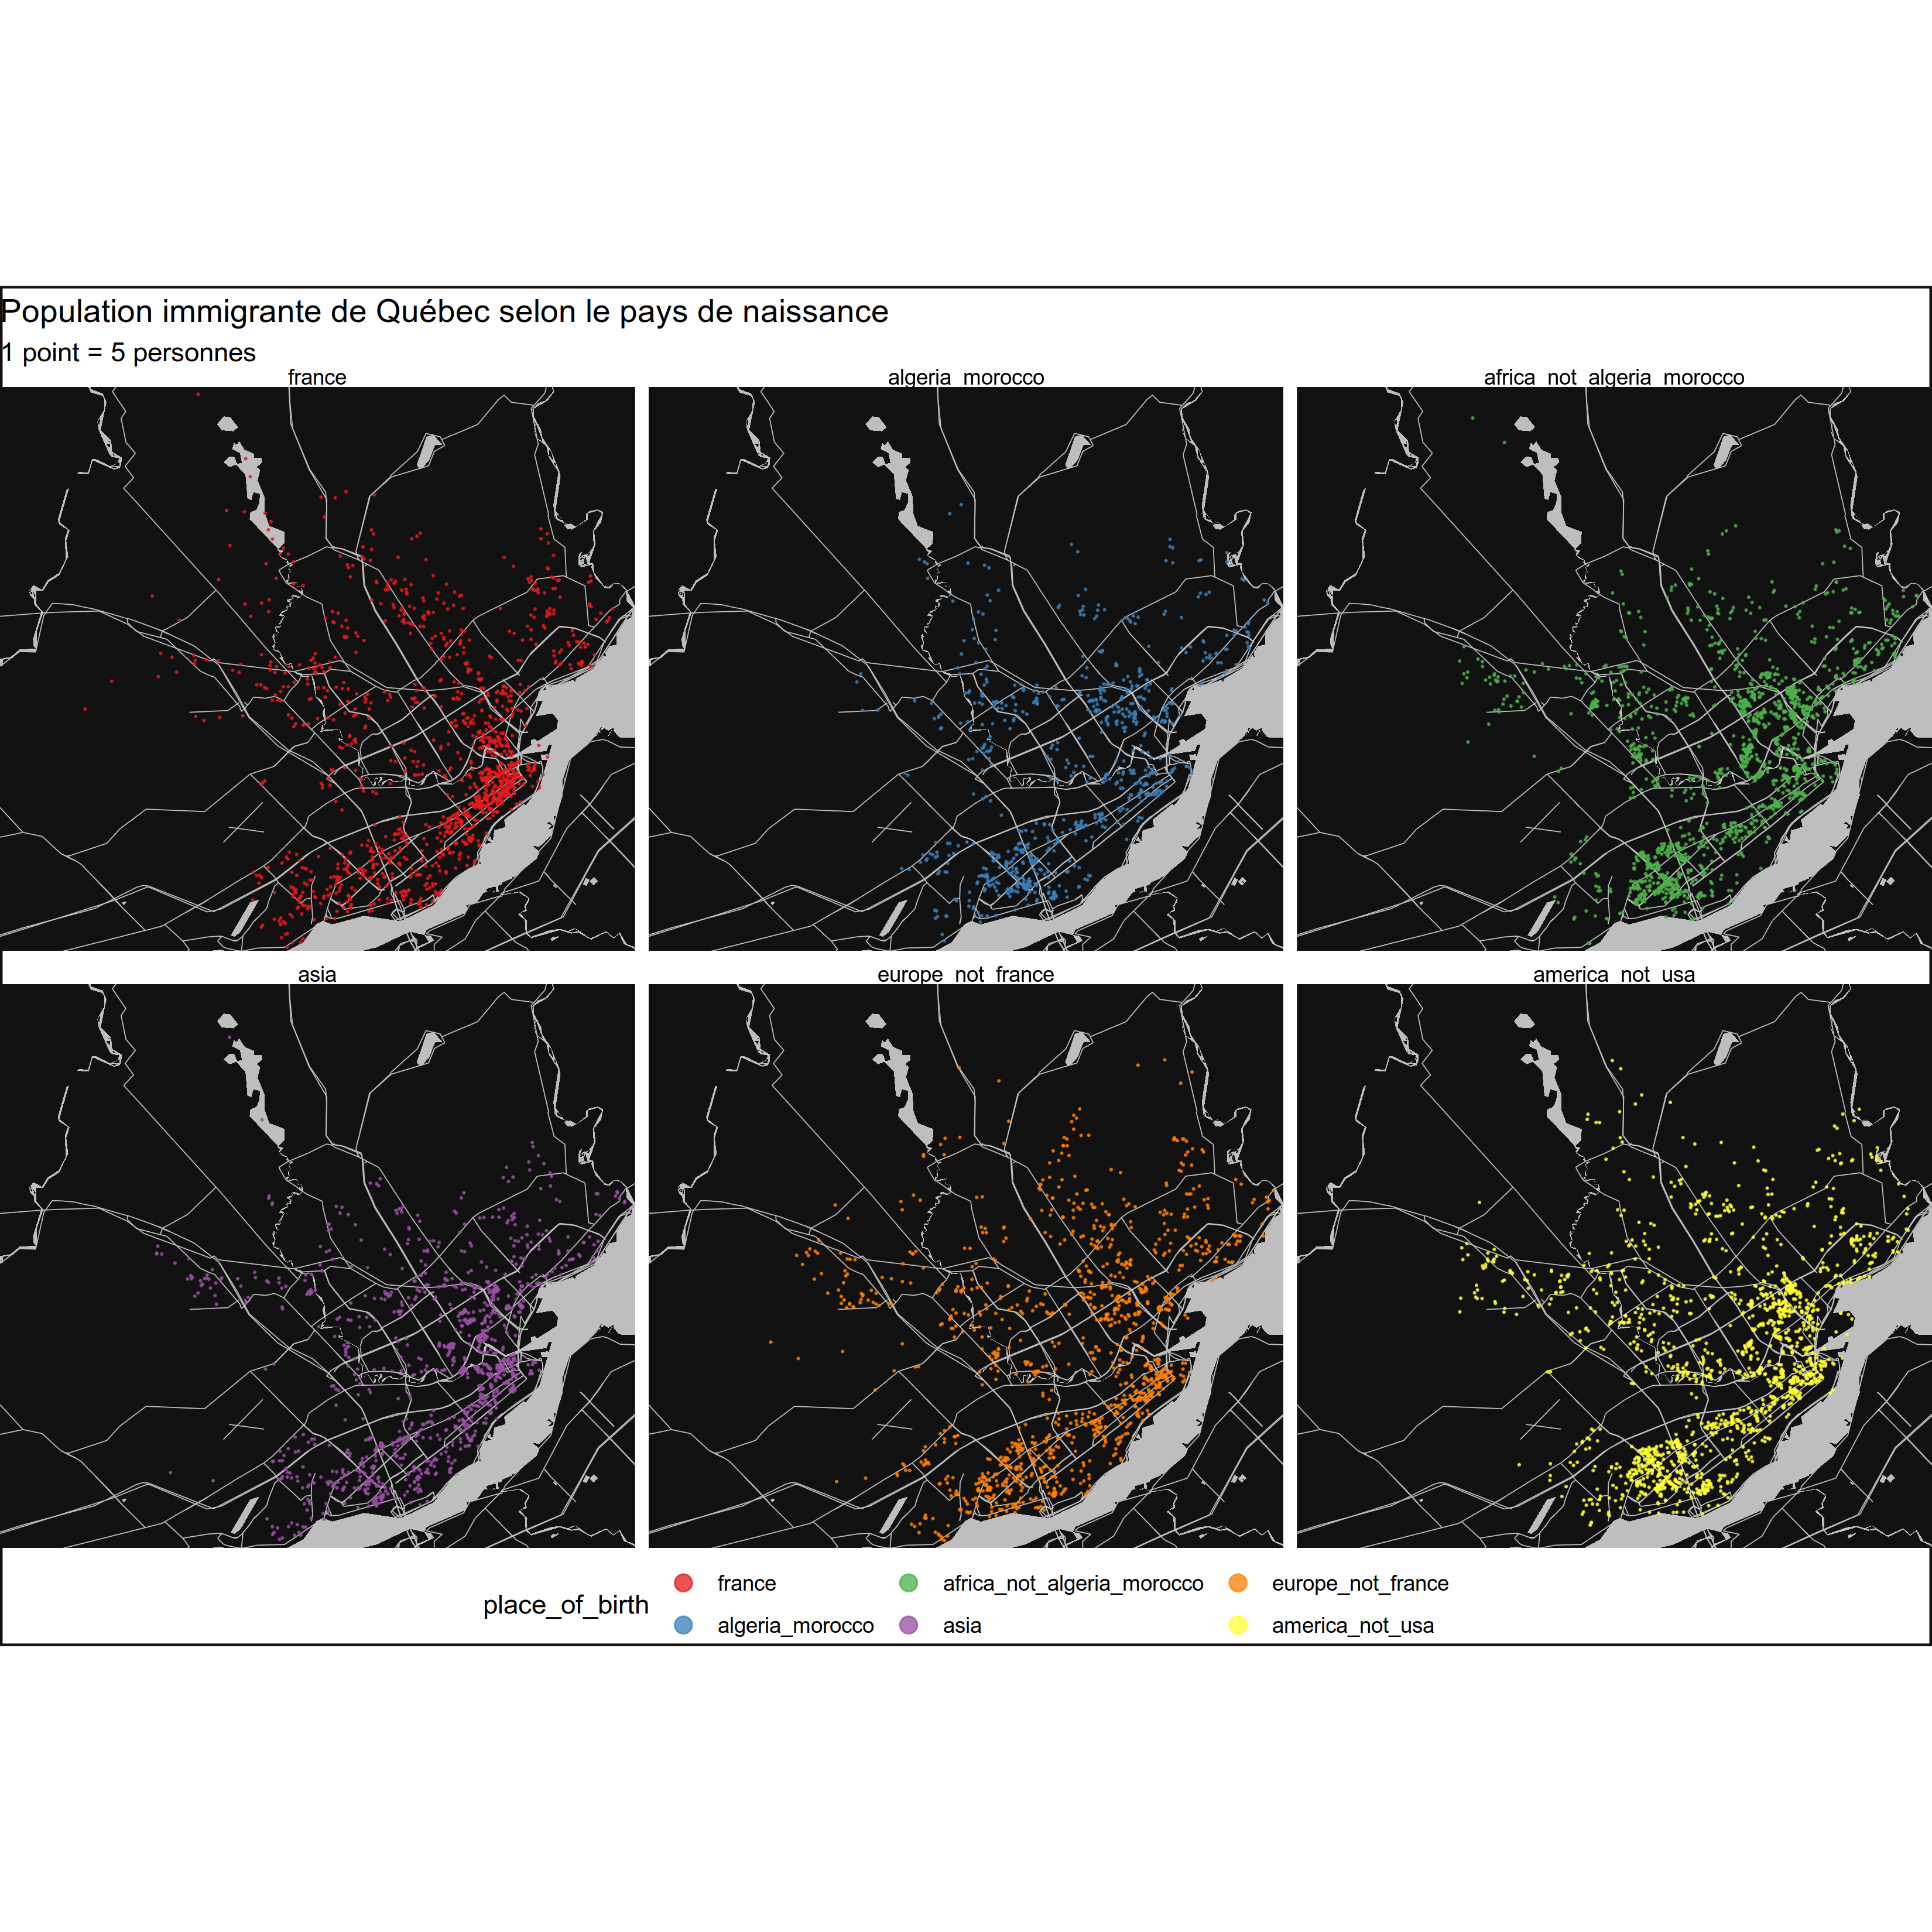
For Quebec City, the pattern appears less clear. French people sure love the old city.
As usual, the code is available on github
if (switch_generate_interim_data){
region=search_census_regions("Montréal","CA16",level="CSD") %>% as_census_region_list()

variables <- search_census_vectors("Total - Selected places of birth for the immigrant population in private households","CA16","Total") %>% child_census_vectors(leaves_only=TRUE)
mtl <- get_census("CA16",regions=region,vectors=variables$vector,level="DA",labels="short",geo_format="sf") %>%
  detail_labels %>%
  clean_names()


top10 <- mtl[,13:67]
st_geometry(top10) <- NULL
top10 %>% summarise_all(sum, na.rm = TRUE) %>% gather(key=key, value=value) %>% arrange(-value) %>% head(10)
#
# # A tibble: 10 x 2
# key                               value
# <chr>                             <dbl>
#   1 haiti                             75590
# 2 other_places_of_birth_in_africa   73560
# 3 france                            56650
# 4 morocco                           54390
# 5 algeria                           54345
# 6 italy                             48830
# 7 other_places_of_birth_in_americas 48695
# 8 china                             43335
# 9 other_places_of_birth_in_asia     39800
# 10 lebanon                           35830

mtl3 <- mtl %>% mutate(
  oceania = oceania_and_other_places_of_birth,
  asia=  afghanistan +                      bangladesh      +                  china      +                       hong_kong +
   india       +                      iran     +                         iraq  +
    japan  +
    korea_south+
    lebanon                          +
    pakistan        +
    philippines +
    sri_lanka    +
    syria   +
    taiwan          +
    viet_nam   +
    other_places_of_birth_in_asia,
  americas =  brazil +colombia + el_salvador + guyana +haiti+jamaica+mexico+peru+trinidad_and_tobago+united_states+other_places_of_birth_in_americas,
  europe = bosnia_and_herzegovina +           croatia  +
    france       +                     germany +                         greece   +                         hungary         +
    ireland      +                     italy   +                          netherlands   +                    poland+
    portugal+                          romania  +                         russian_federation    +            serbia+
    ukraine  +                         united_kingdom +                   other_places_of_birth_in_europe ,
  africa = algeria  +
   egypt +                            ethiopia +                         kenya       +                      morocco  +
   nigeria   +                        somalia   +                        south_africa_republic_of    +      other_places_of_birth_in_africa,
  rest_of_americas = americas - haiti,
  rest_of_europe = europe - france- italy,
  rest_of_africa = africa - morocco - algeria,
  rest_of_asia = asia - china - lebanon,
  algeria_morocco = algeria + morocco

)

categories <- c("haiti", "france", "italy", "algeria_morocco",  "china", "lebanon" )

#  cookbook check for na
# mtl4 %>%
#   select_if(function(x) any(is.na(x))) %>%
#   summarise_each(funs(sum(is.na(.)))) -> extra_NA
# extra_NA
# mtl4 %>% filter(is.na(rest_of_americas))

bbox=sf::st_bbox(mtl3 %>% sf::st_sf())

rmapzen::mz_set_tile_host_nextzen(Sys.getenv("nextzen_api_key"))
mx_box=rmapzen::mz_rect(bbox$xmin,bbox$ymin,bbox$xmax,bbox$ymax)
vector_tiles <- rmapzen::mz_vector_tiles(mx_box)

# vector tiles return all layers (roads, water, buildings, etc) in a list
roads <- rmapzen::as_sf(vector_tiles$roads) %>% dplyr::filter(kind != "ferry")
water <- rmapzen::as_sf(vector_tiles$water)

dots <- compute_dots(mtl3 %>% filter(!is.na(haiti)),categories,scale=20) %>%
  rename(place_of_birth=Category)

bg_color="#111111"
text_color = bg_color

myplot <- ggplot() +
  geom_sf(data = water, fill = "grey", colour = NA) +
  geom_sf(data = roads, size = .2, colour = "grey") +
  geom_sf(data=dots , aes(color=place_of_birth),alpha=0.75,size=0.05,show.legend = "point") +
  facet_wrap(~place_of_birth)+
  #ggthemes::theme_map()  +
  map_theme +
  scale_color_brewer(palette = "Set1") +
  labs(title="Population immigrante de Montréal selon le pays de naissance",subtitle="1 point = 20 personnes")+
  theme(legend.position="bottom",
        panel.background = element_rect(fill = bg_color, colour = NA),
        plot.background = element_rect(fill="white", size=1,linetype="solid",color=text_color)
  ) +
  guides(colour = guide_legend(override.aes = list(size=3))) +
  coord_sf(datum=st_crs(mtl),
           expand=FALSE,
           xlim=c(bbox$xmin,bbox$xmax),
           ylim=c(bbox$ymin,bbox$ymax))


ggsave(filename=  here::here("static/post/2019-04-24-montreal-melting-pot_files" , "place_of_birth.png"), plot = myplot, width=11,height=11)
}
if (switch_generate_interim_data){
myplot_nofacet <- ggplot() +
  geom_sf(data = water, fill = "grey", colour = NA) +
  geom_sf(data = roads, size = .2, colour = "grey") +
  geom_sf(data=dots , aes(color=place_of_birth),alpha=0.75,size=0.05,show.legend = "point") +
  #ggthemes::theme_map()  +
  map_theme +
  scale_color_brewer(palette = "Set1") +
  labs(title="Population immigrante de Montréal selon le pays de naissance",subtitle="1 point = 20 personnes")+
  theme(legend.position="bottom",
        panel.background = element_rect(fill = bg_color, colour = NA),
        plot.background = element_rect(fill="white", size=1,linetype="solid",color=text_color)
  ) +
  guides(colour = guide_legend(override.aes = list(size=3))) +
  coord_sf(datum=st_crs(mtl),
           expand=FALSE,
           xlim=c(bbox$xmin,bbox$xmax),
           ylim=c(bbox$ymin,bbox$ymax))


ggsave(filename=  here::here("static/post/2019-04-24-montreal-melting-pot_files" , "place_of_birth_mtl_nofacet.png"), plot = myplot, width=11,height=11)
}