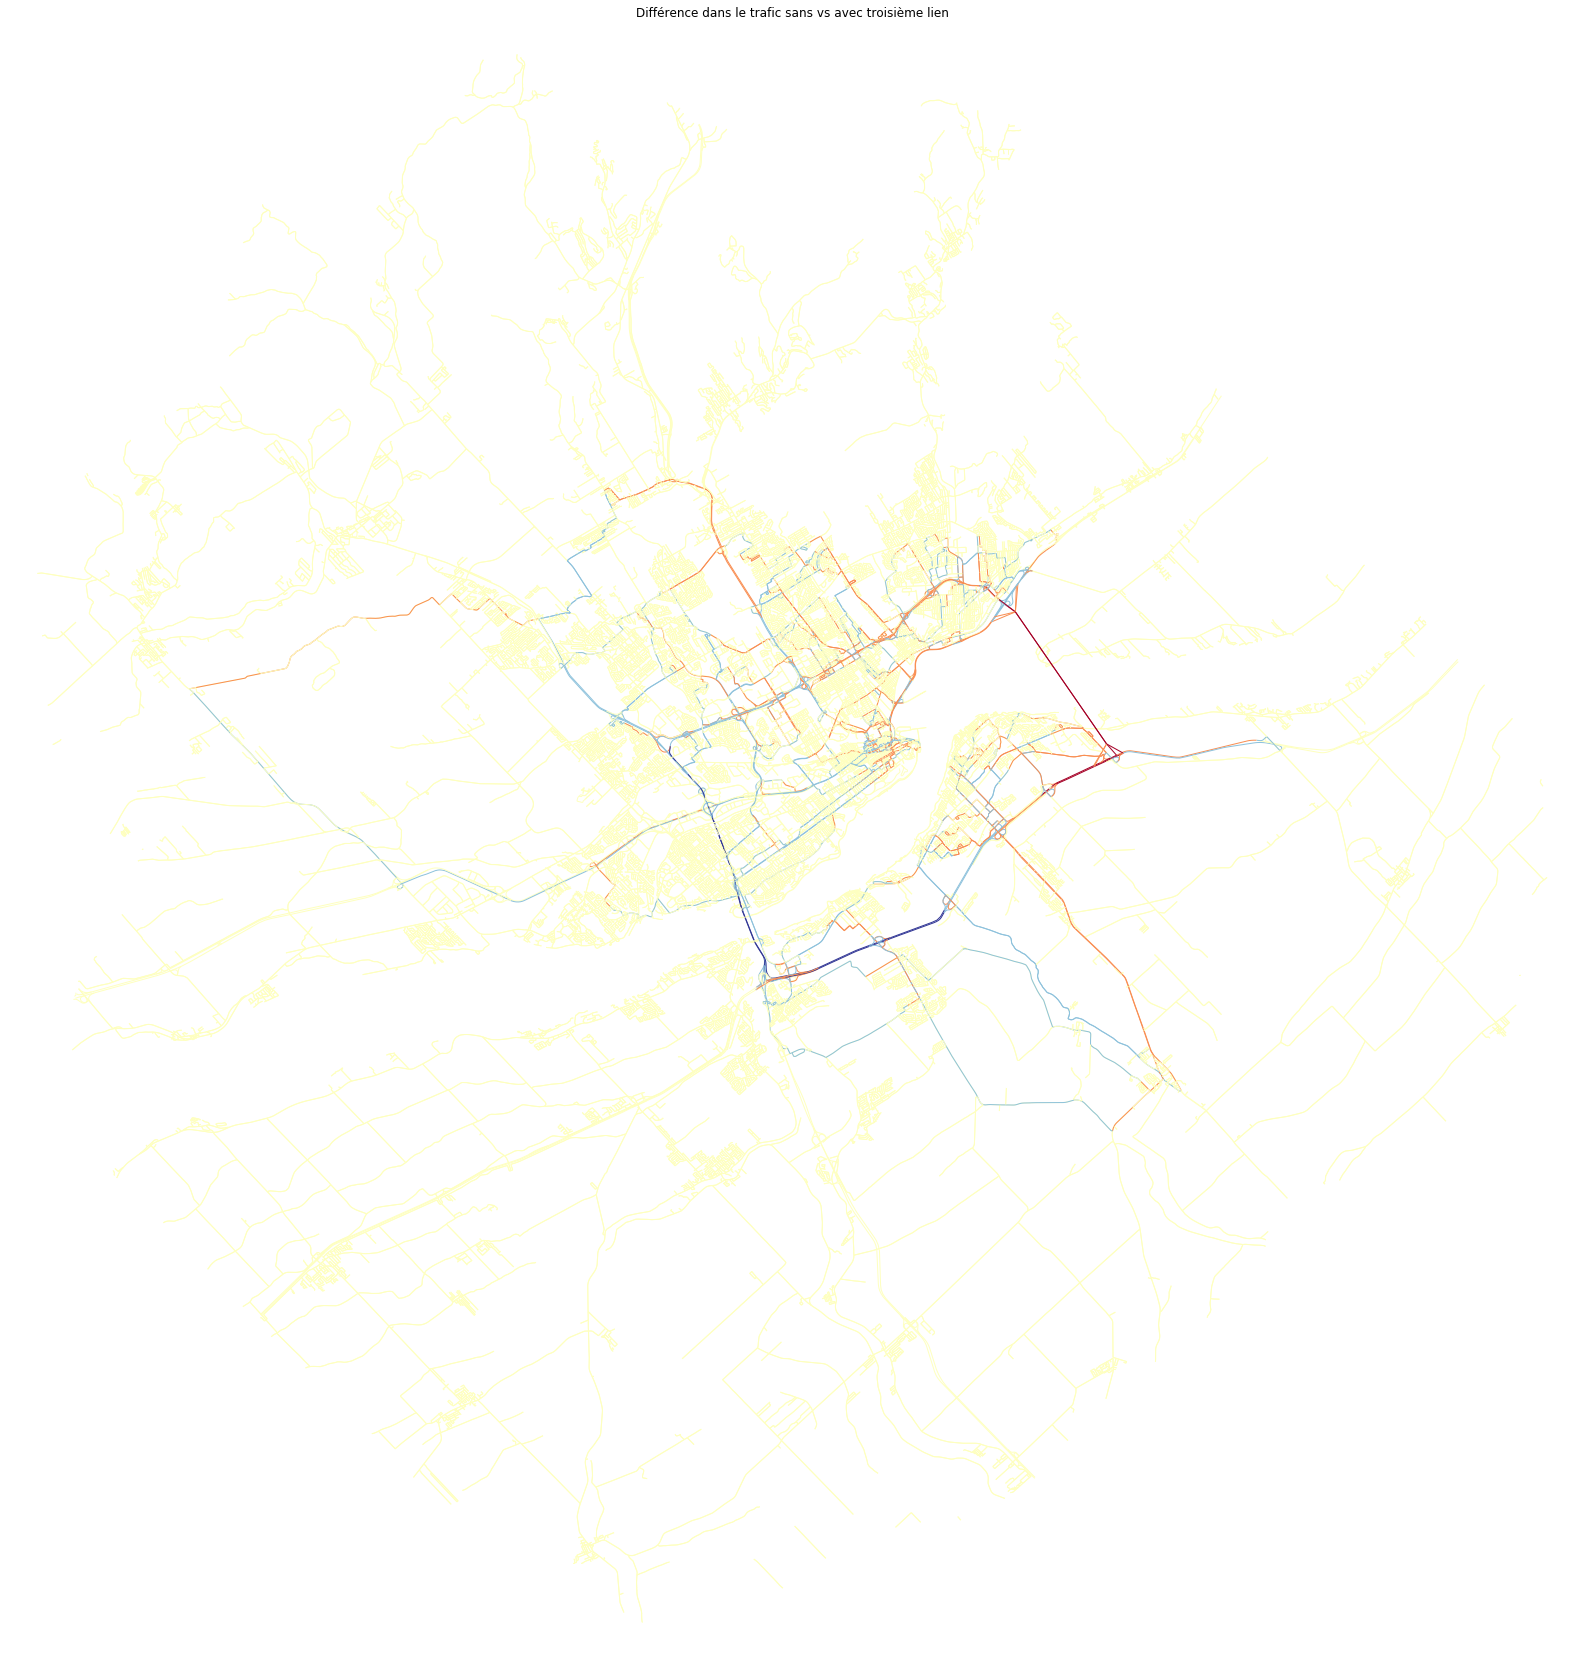
Dans ce projet-jouet, j’ai utilisé les données ouvertes de l’application Mon Trajet et le package python osmnx pour estimer l’impact de la construction d’un troisième lien sur le trafic de la ville de Québec.
Le scénario retenu est le cinquième des scénarios proposés, soit celui reliant l’intersection de l’autoroute Dufferin-Montmorency et de l’autoroute Félix-Leclerc au nord à l’autoroute 20 à la hauteur de la route l’Allemand au sud.
Exceptionnellement, j’utilise le langage Python car le package osmnx à lui seul permet d’effectuer toutes les étapes du projet, soit:
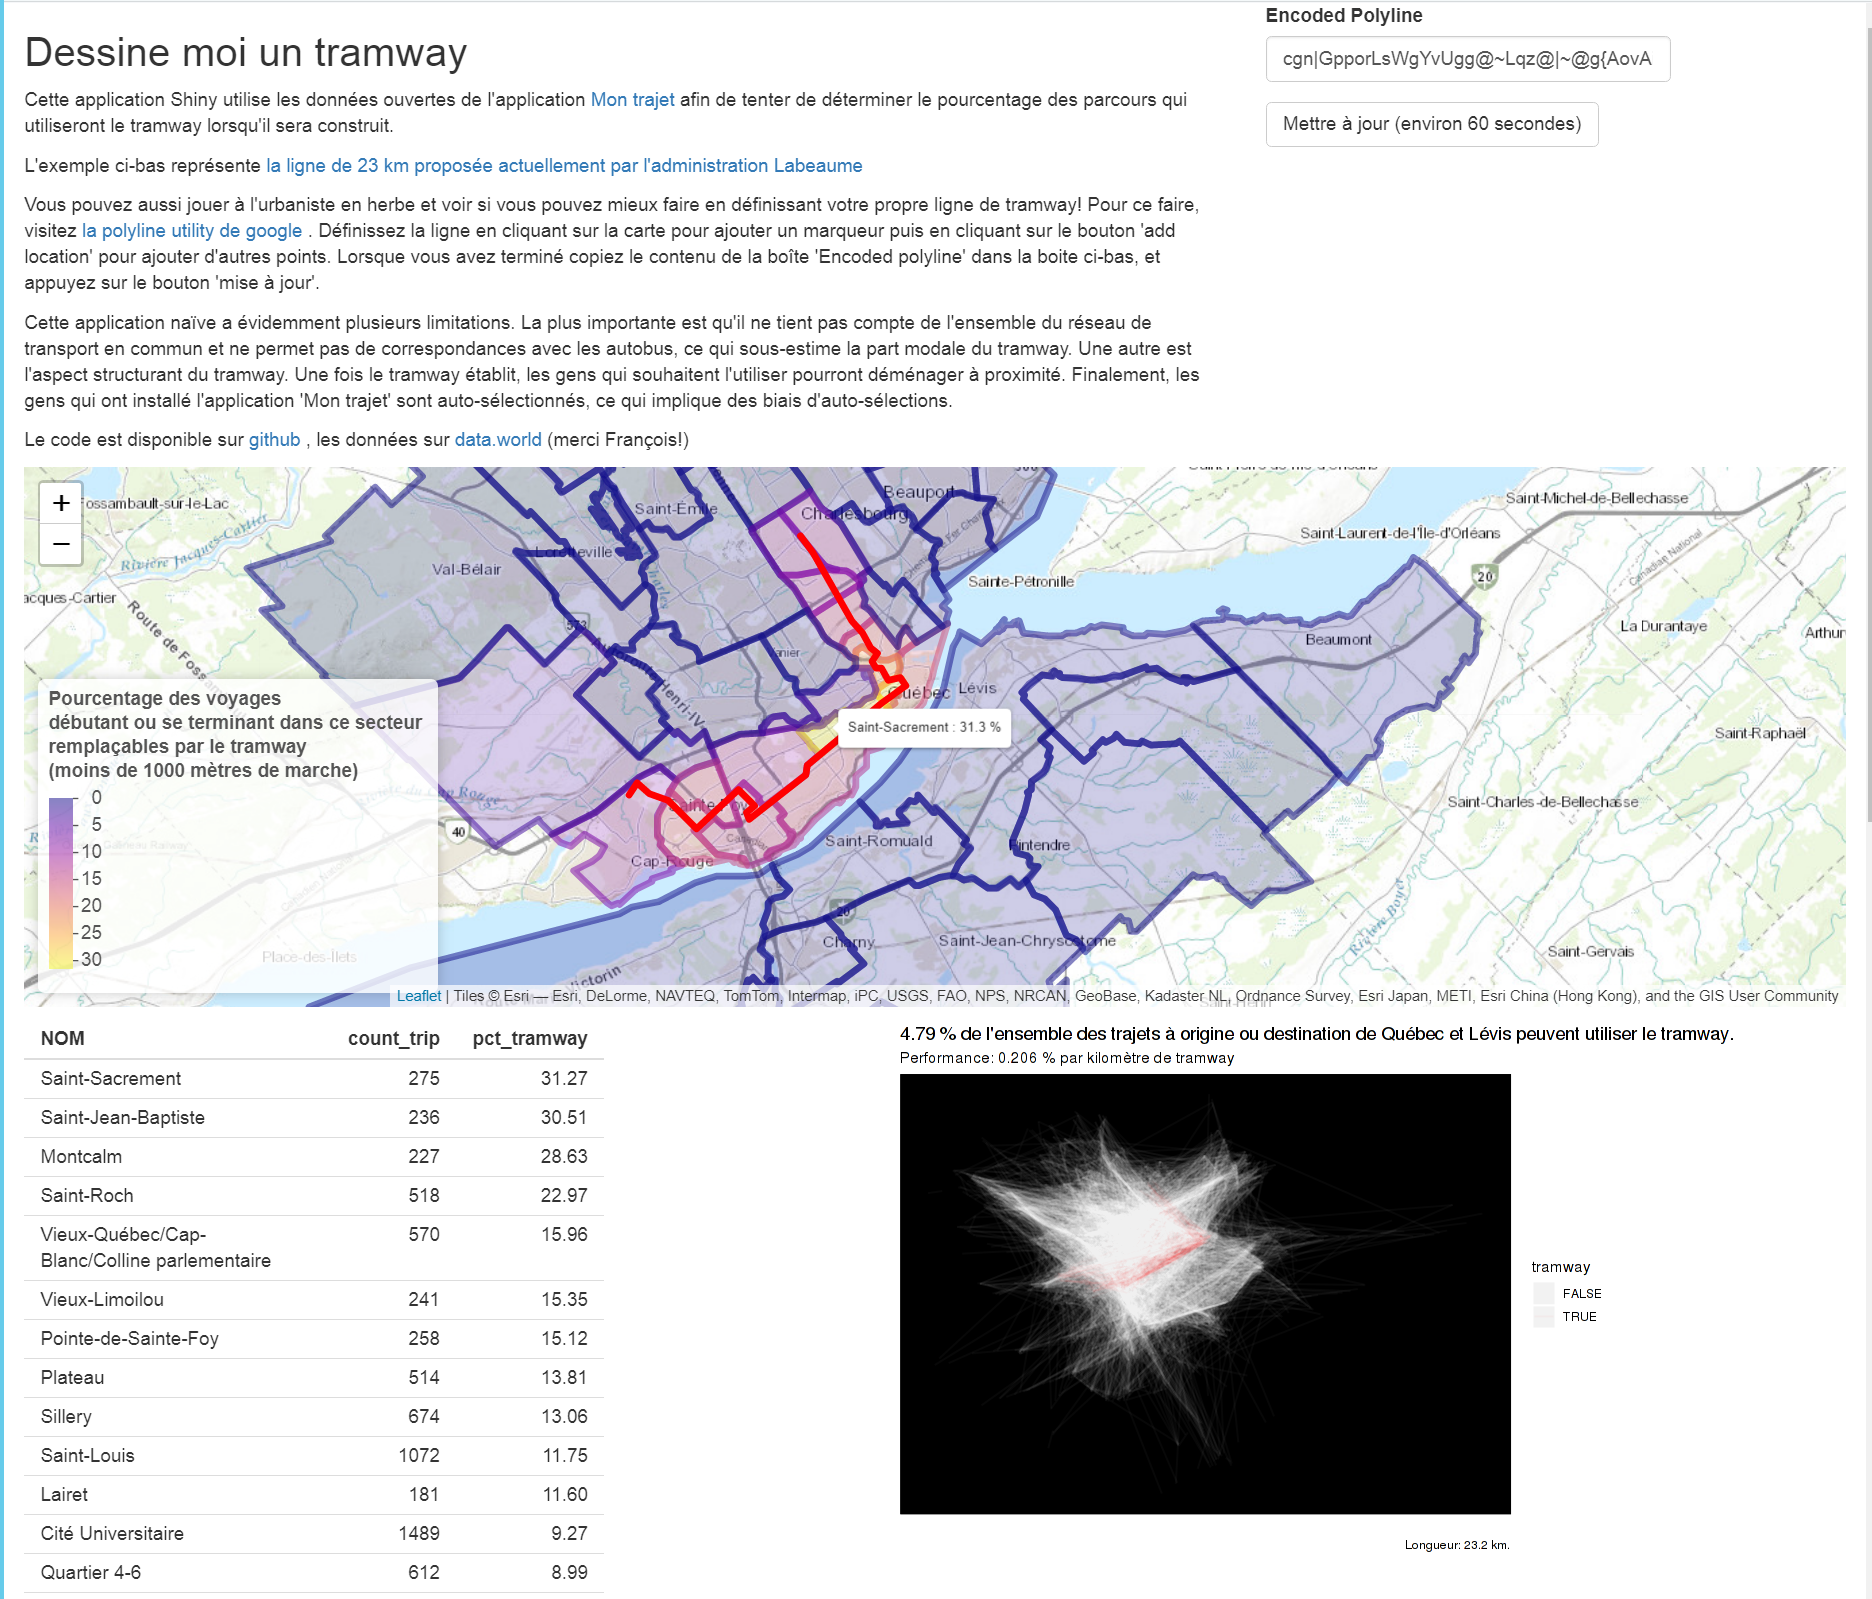
J’ai créé une application qui vise à prédire la part modale du tramway proposé de la ville de Québec. Pouvez-vous dessiner un meilleur tramway que le maire?
En 2014, l’application “Mes trajets” a recensé 16 000 trajets en auto effectués par les habitants de la région de Québec et Lévis. Je compare ces trajets d’auto au tracé de tramway afin de voir lesquels pourraient utiliser le tramway.
J’ai dû faire des hypothèses fortes pour simplifier.
UPDATE 2020: skimr v2 now produces nice html in rmarkdown, so skimr::kable() has been deprecated. https://www.r-bloggers.com/reintroducing-skimr-v2-a-year-in-the-life-of-an-open-source-r-project/
Introduction Ratemaking models in insurance routinely use Poisson regression to model the frequency of auto insurance claims. They usually are GLMs but some insurers are moving towards GBMs, such as xgboost.
xgboosthas multiple hyperparameters that can be tuned to obtain a better predictive power. There are multiple ways to tune these hyperparameters. In order of efficiency are the grid search, the random search and the bayesian optimization search.
Context The Summer of 2018 was ridiculously hot and we decided that we wanted to buy a central air conditioning unit. Would spending more to get an air-air heat pump instead make economic and environmental sense?
a quick note: shopping for heat pumps sucks. Every salesman claims to have the best reliability and service, and there is no independent source that will help you sort it out.
A quick introduction to heat pumps The air-to-air heat pump is an amazing device.
I have recently had to deploy a public-facing shiny dashboard. I decided this would be the perfect time to create my first google cloud machine. The main reasons I decided to do it on the cloud are as follow:
* No need to open port on my home computer * Guaranteed to be always on * Free ( I chose a f1-micro instance) This guide by Luis Henrique Zanandrea Paese on GitHub covered all the bases I needed to covered to start my first RStudio / Shiny server.
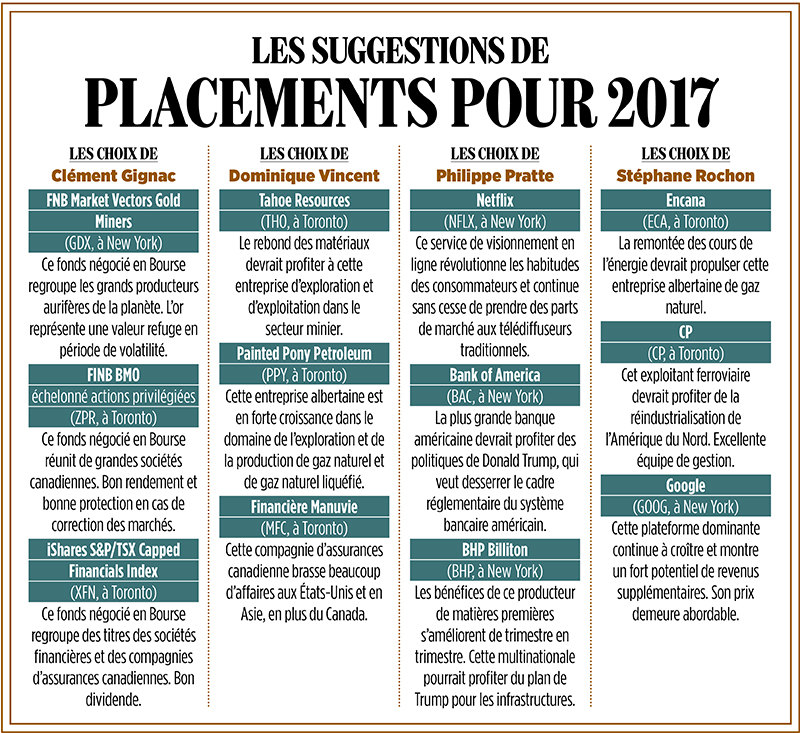
Intro L’actualité, has recently published 2018 annual list of stocks recommended by experts. I usually welcome these lists with a sigh, but this time I thought I’d compare the past results of portfolios built using their past suggestions to the returns an investor would have received by following a “couch potato” investing.
The couch potato portfolio is built using 33% Canadian index stocks, 33% American stocks and 33% international stocks.
This Notebook builds on the poll_final sf dataframe we built in the first part of this project. poll_final contains the poll results by party and the geometry for each poll for the 2015 Federal Elections of 2015.
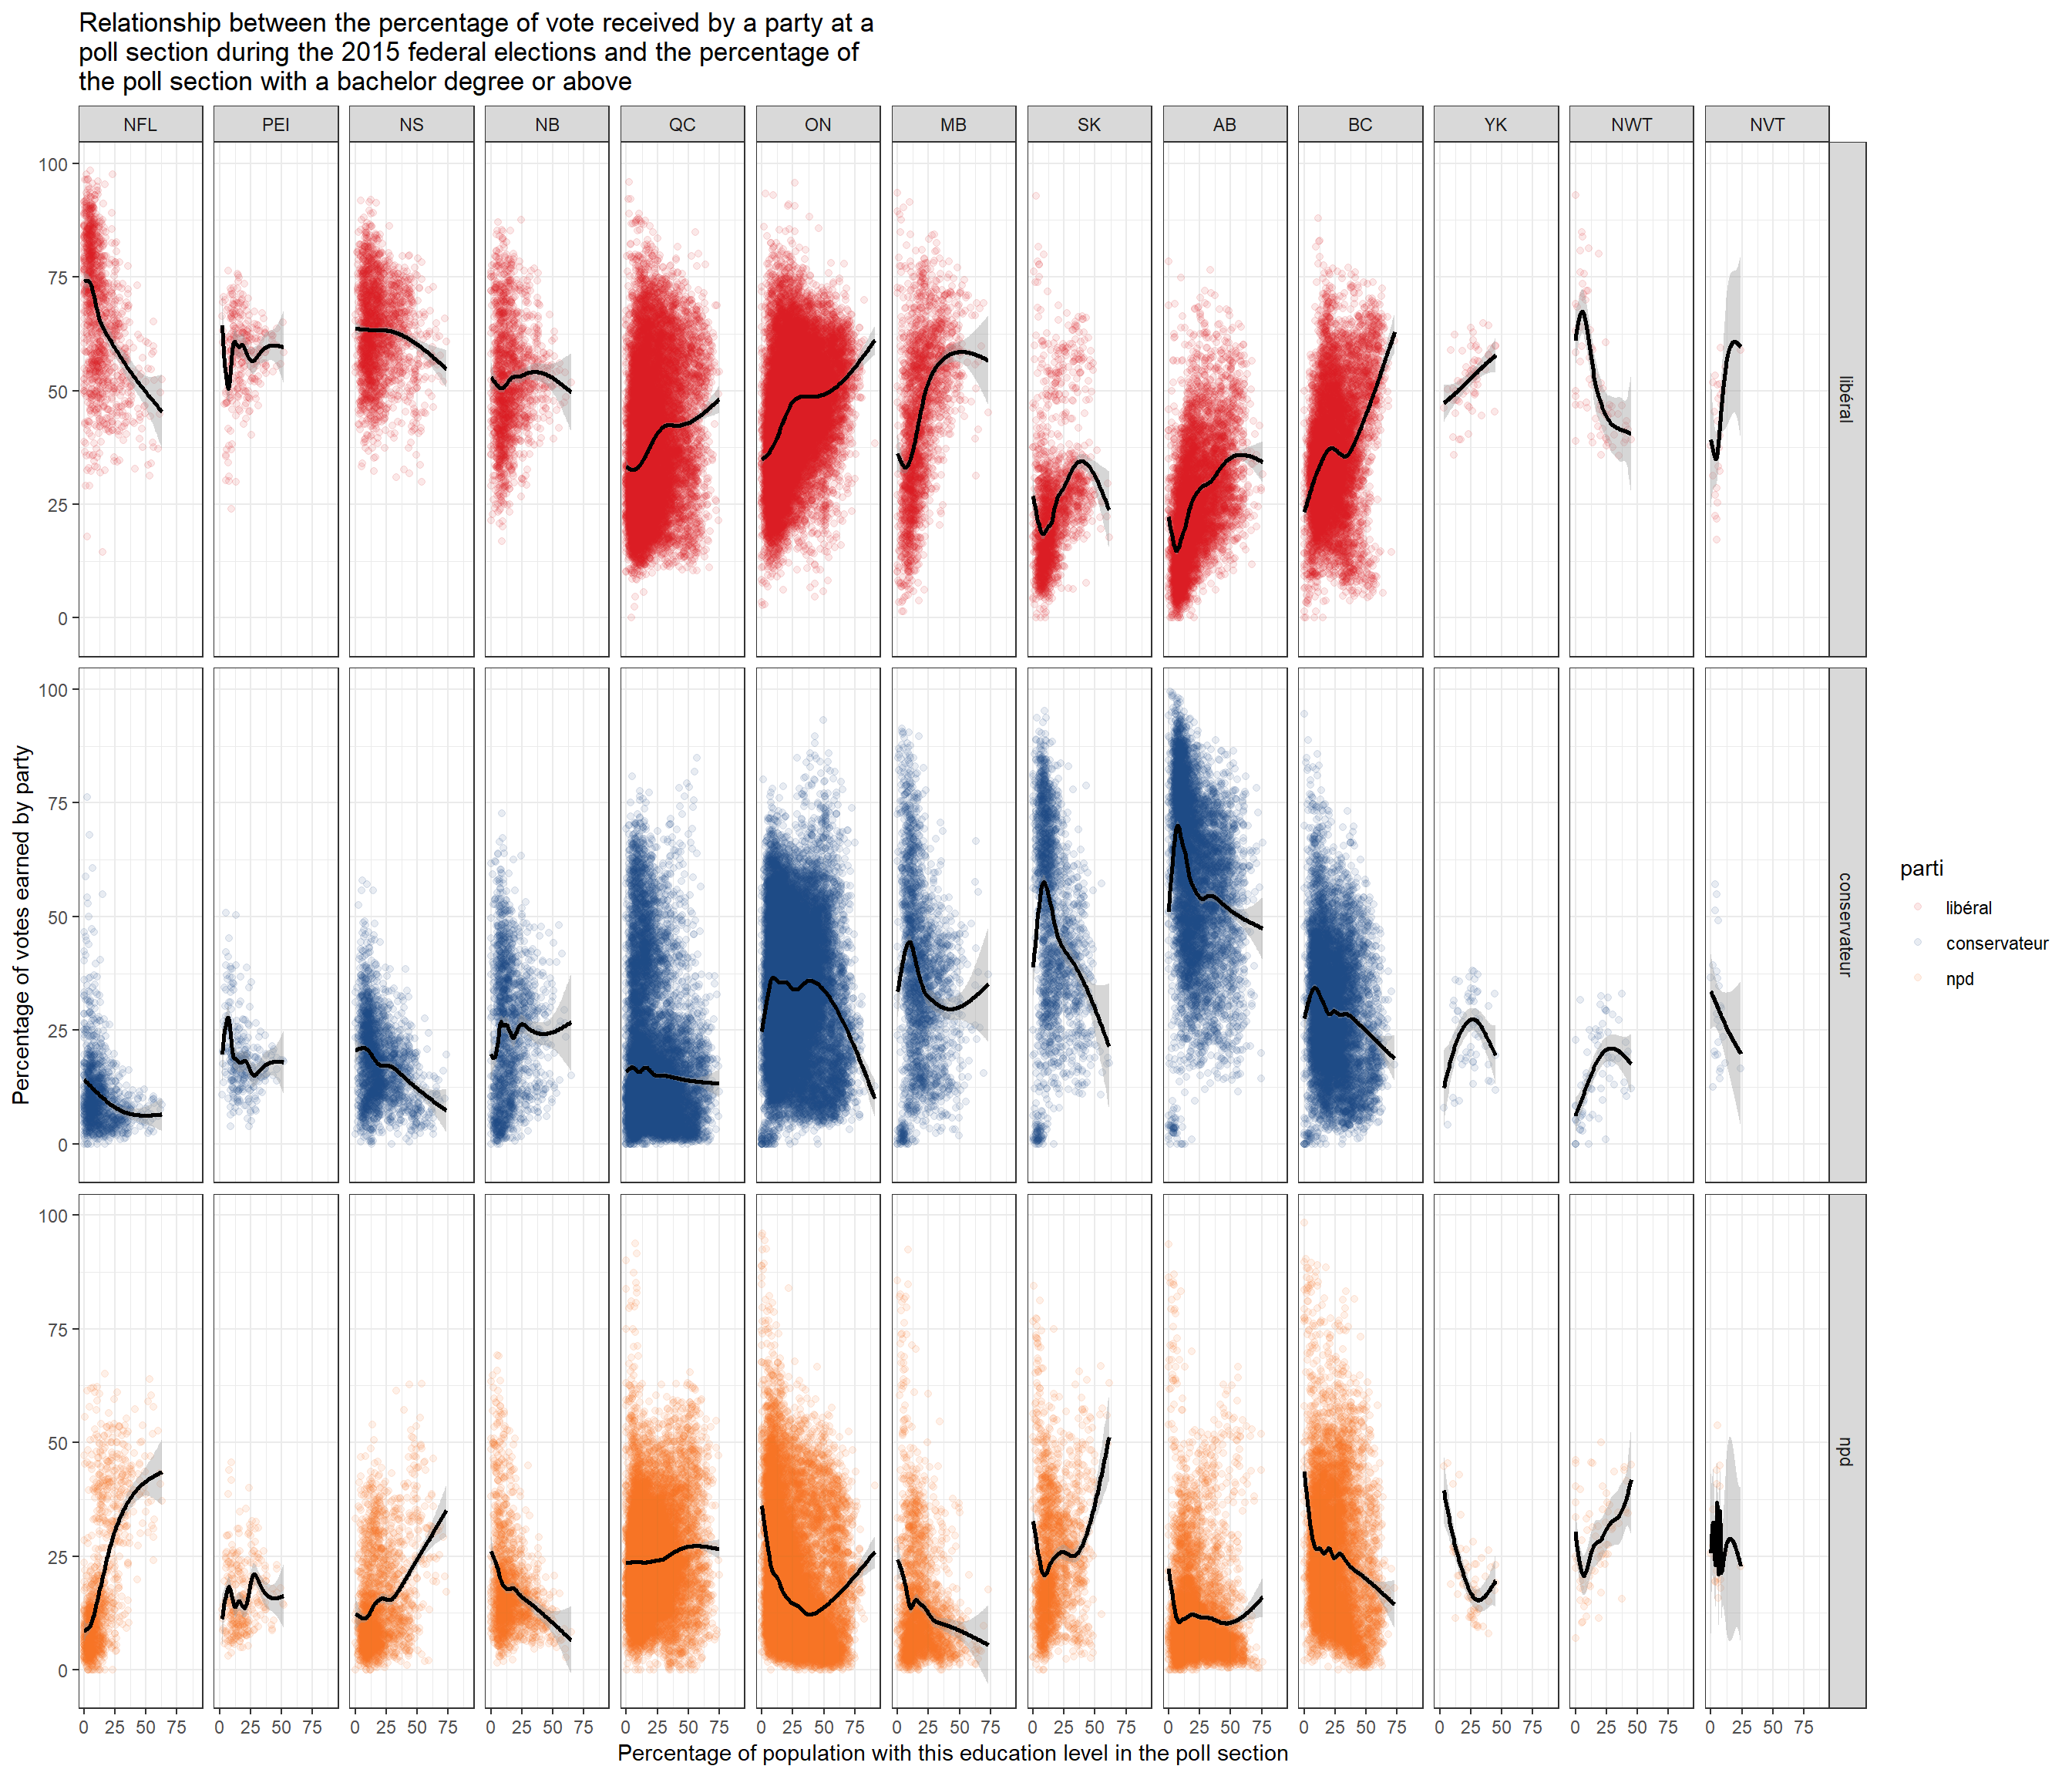
We will use the cancensus package to download sociodemographic data and geometry from the 2016 Canadian Census. We will then “dispatch” the population characteristics to each poll sections and plot the relationship between education and the results of the three main parties (libéral, conservateur and ndp).