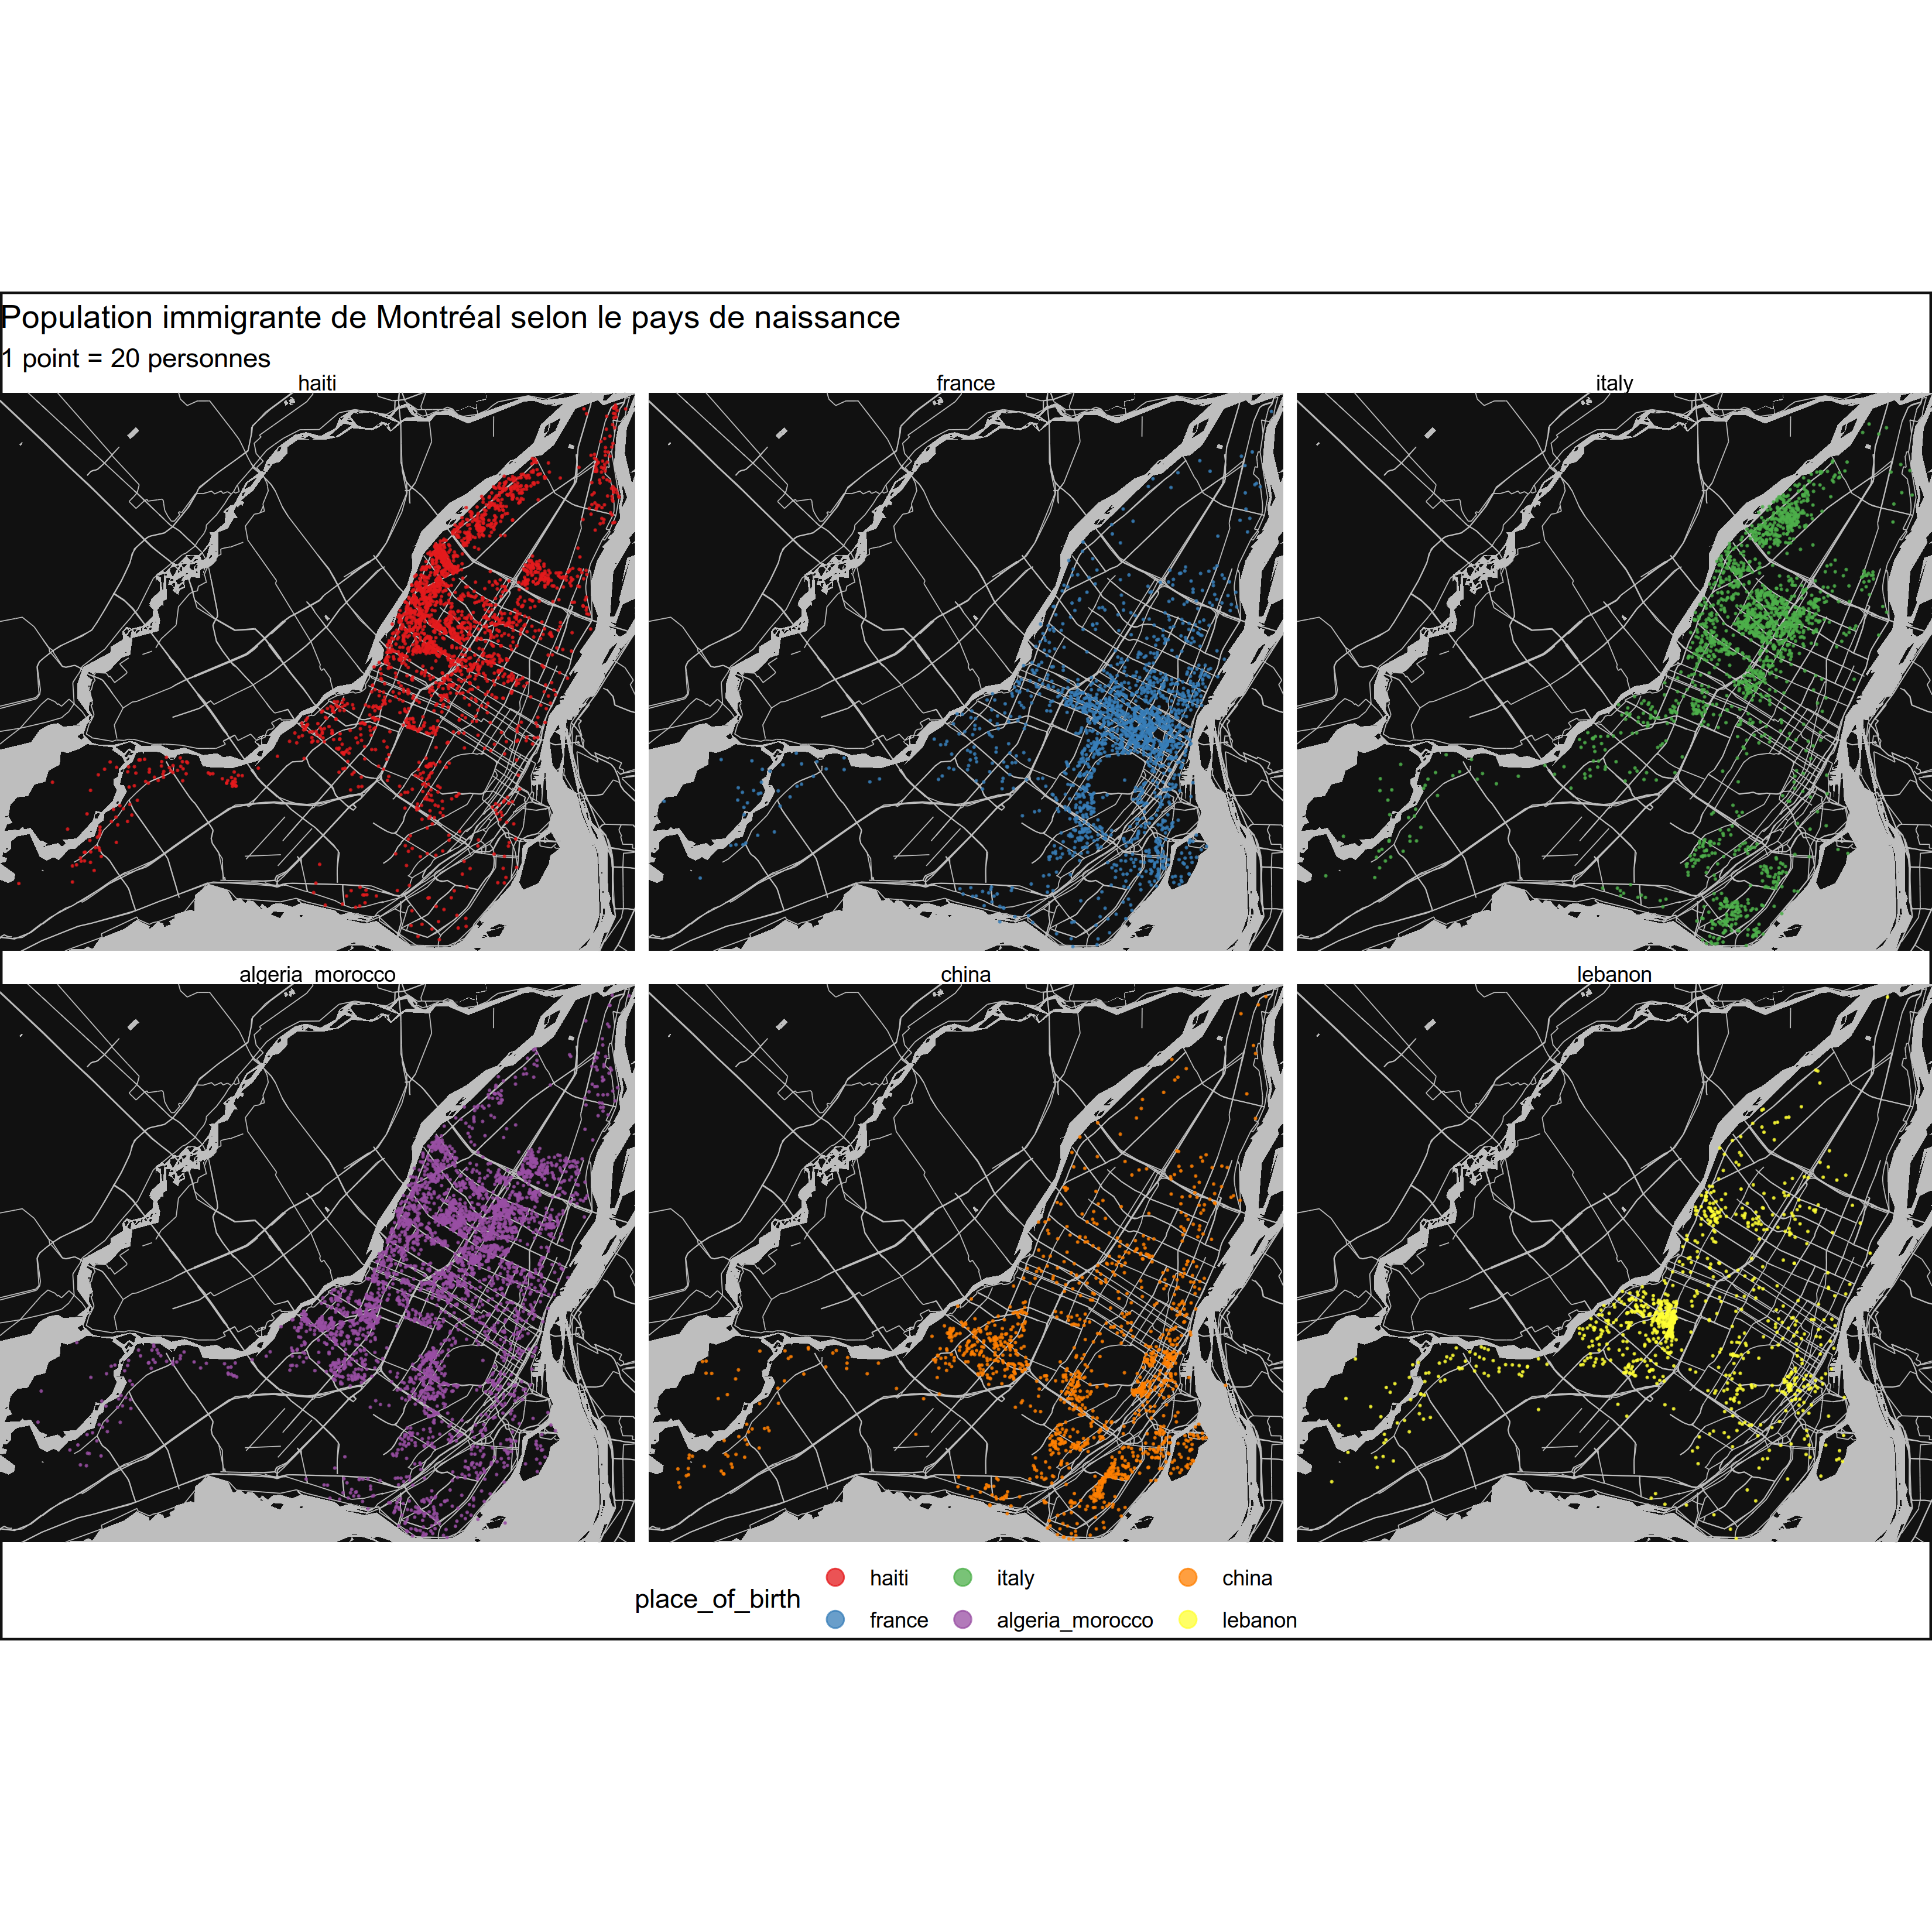
A recent by Arthur Charpentier (@freakonometrics) has inspired me to finally give Jens von Bergmann’s (@vb_jens) dotdensity package a run.
I will come back to this code for some examples of how to use dotdensity but also for rmapzen road and water tiles.
At first glance, it appears that the immigrants in Montréal from France, Italy, China and Lebanon won’t run into each other very often. Immigrants from Haiti and Algeria and Morocco and both more likely to be found in the North of the island.
UPDATE 2020: skimr v2 now produces nice html in rmarkdown, so skimr::kable() has been deprecated. https://www.r-bloggers.com/reintroducing-skimr-v2-a-year-in-the-life-of-an-open-source-r-project/
Introduction Ratemaking models in insurance routinely use Poisson regression to model the frequency of auto insurance claims. They usually are GLMs but some insurers are moving towards GBMs, such as xgboost.
xgboosthas multiple hyperparameters that can be tuned to obtain a better predictive power. There are multiple ways to tune these hyperparameters. In order of efficiency are the grid search, the random search and the bayesian optimization search.
Context The Summer of 2018 was ridiculously hot and we decided that we wanted to buy a central air conditioning unit. Would spending more to get an air-air heat pump instead make economic and environmental sense?
a quick note: shopping for heat pumps sucks. Every salesman claims to have the best reliability and service, and there is no independent source that will help you sort it out.
A quick introduction to heat pumps The air-to-air heat pump is an amazing device.
Intro L’actualité, has recently published 2018 annual list of stocks recommended by experts. I usually welcome these lists with a sigh, but this time I thought I’d compare the past results of portfolios built using their past suggestions to the returns an investor would have received by following a “couch potato” investing.
The couch potato portfolio is built using 33% Canadian index stocks, 33% American stocks and 33% international stocks.
This Notebook builds on the poll_final sf dataframe we built in the first part of this project. poll_final contains the poll results by party and the geometry for each poll for the 2015 Federal Elections of 2015.
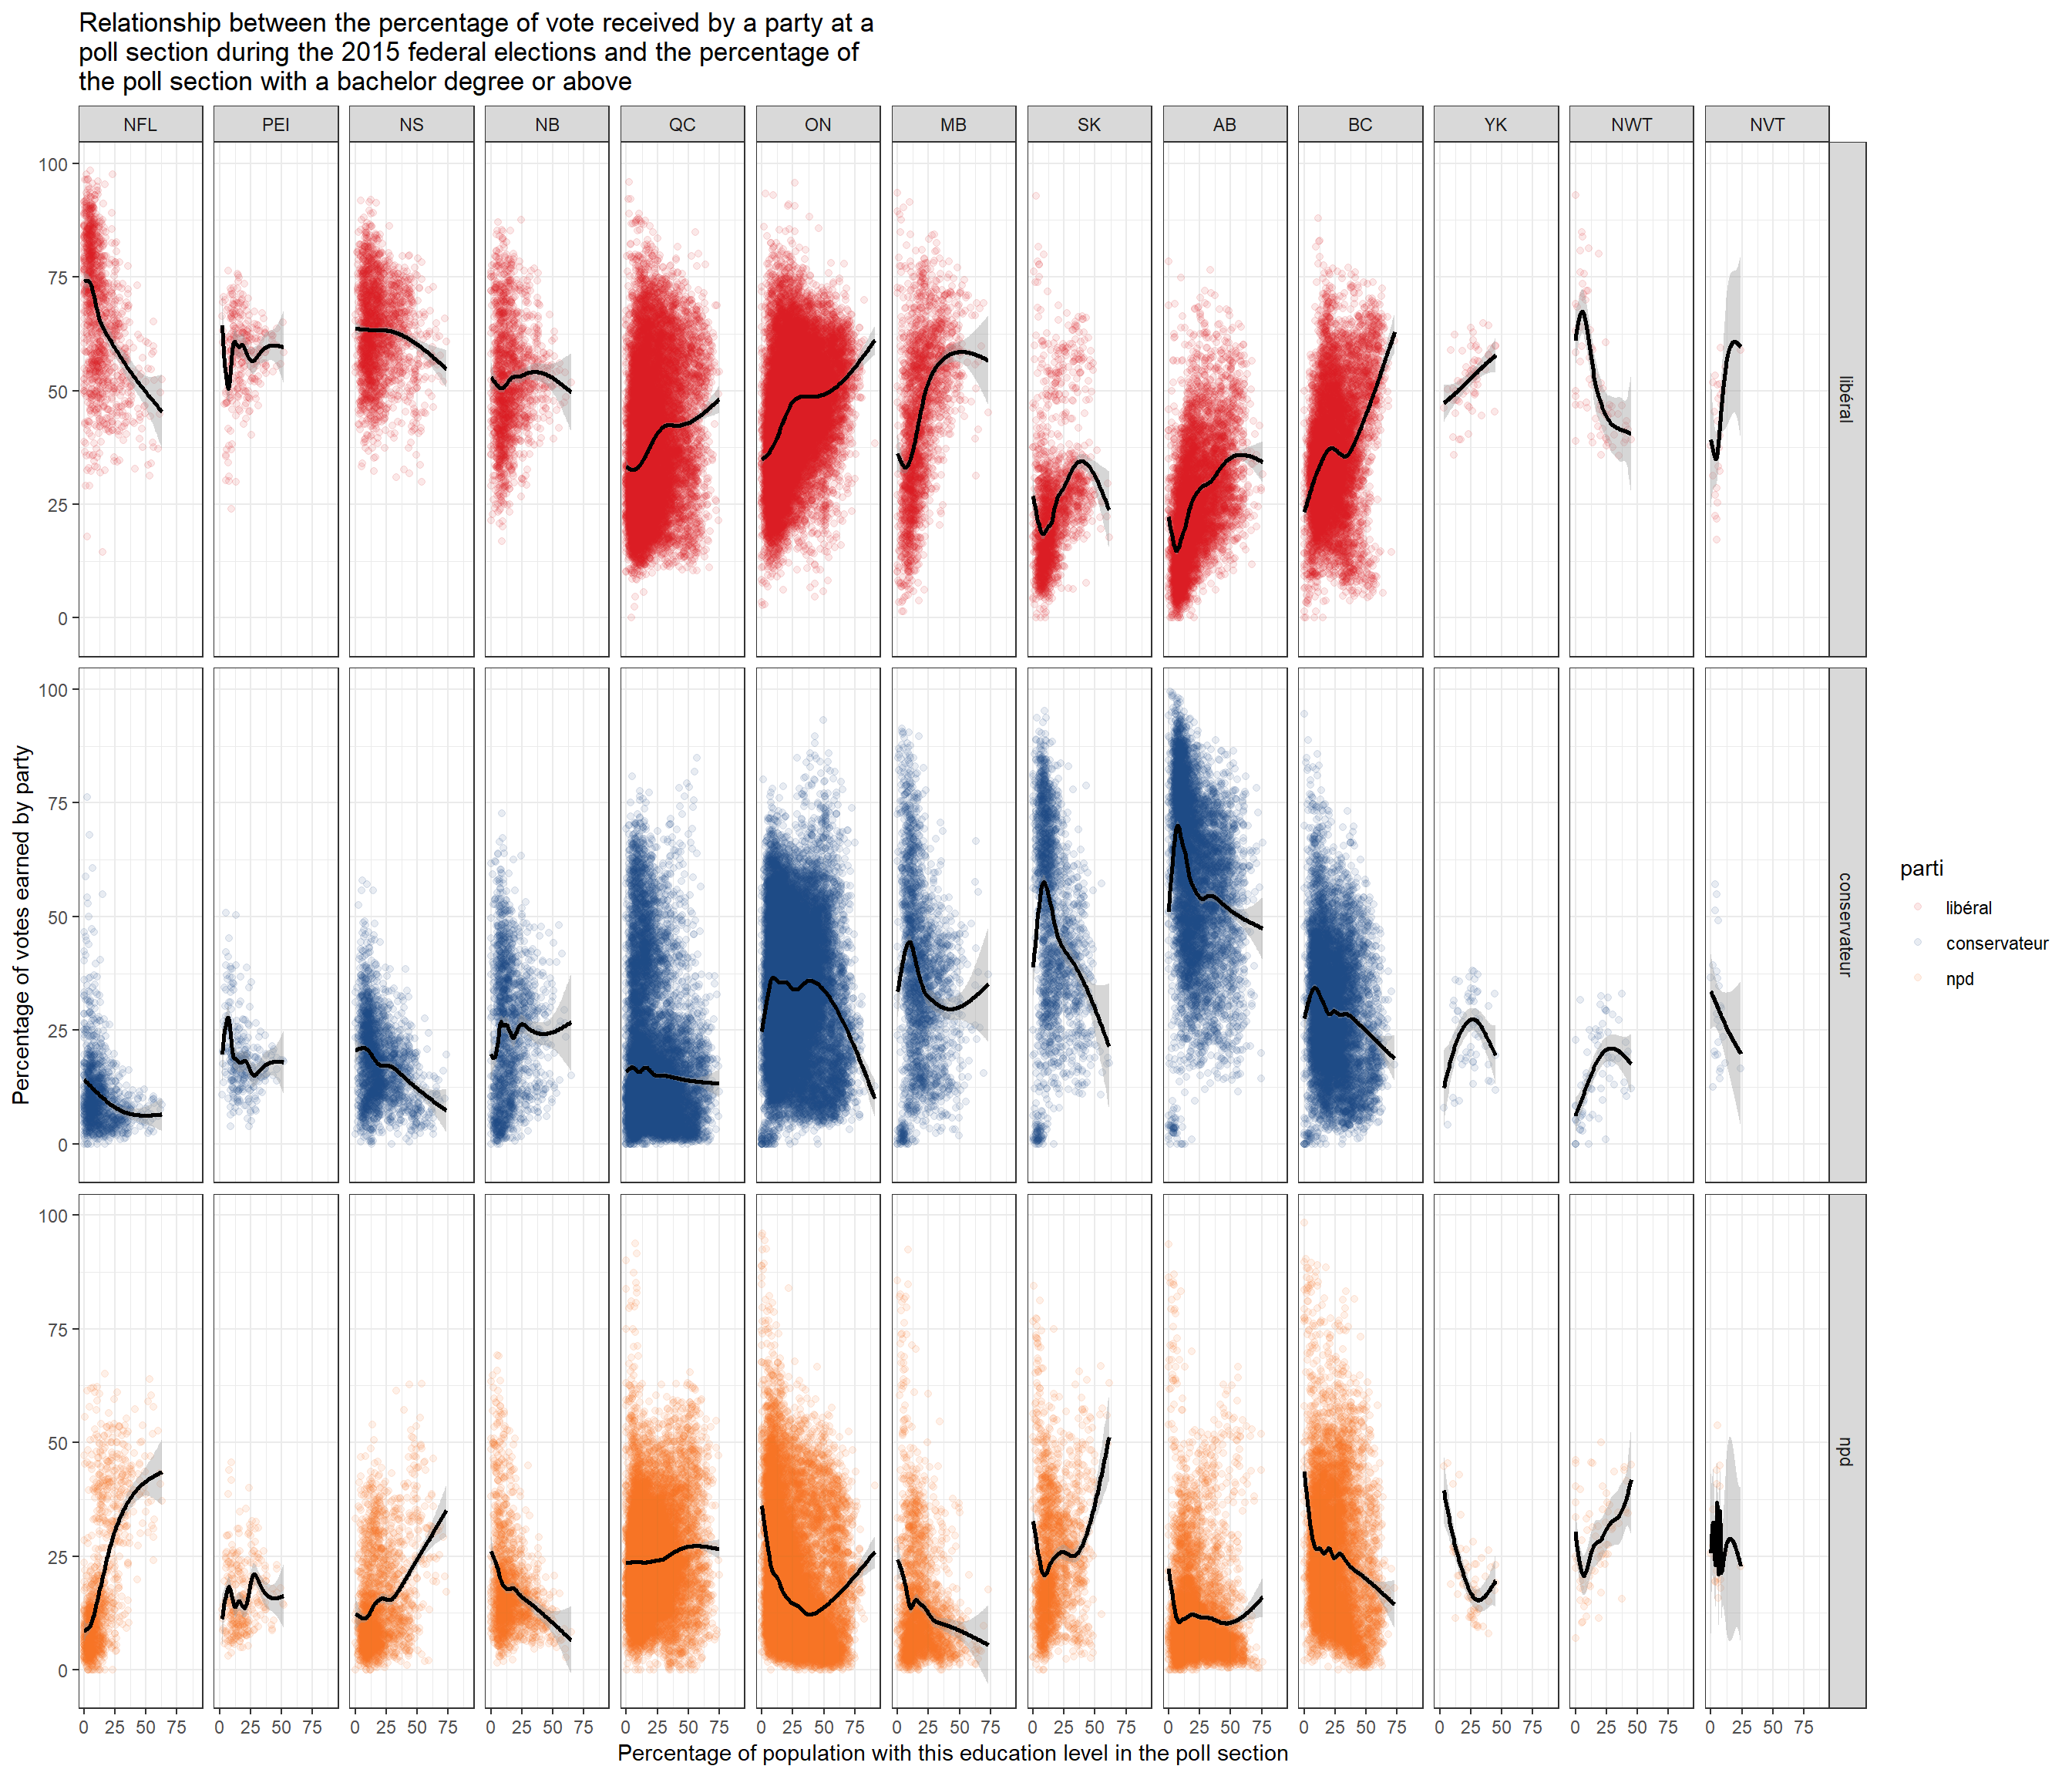
We will use the cancensus package to download sociodemographic data and geometry from the 2016 Canadian Census. We will then “dispatch” the population characteristics to each poll sections and plot the relationship between education and the results of the three main parties (libéral, conservateur and ndp).
Intro The goal of this project is to study how the voting patterns in the 42nd Canadian General Election of 2015 was influenced by socioeconomic characteristics of voters at the poll level.
The project will be split in two (lengthy) posts.
In the first post, we will clean the election results and the election shapefiles and create a map of the results. Our goal is to create a sfdata frame that will allow us to recreate this interactive map by CBC.
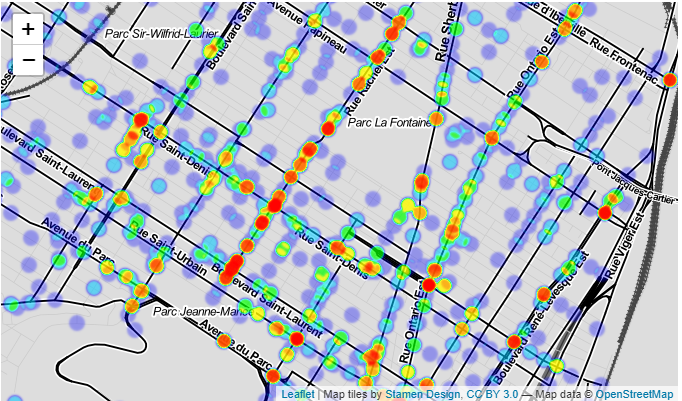
Objective In this project, we will geocode the crash data to identify the spots where the accidents involving bikes in province. This will allow us to determine in which areas an intervention to reduce the risk to active transportation would be most useful.
Data sources Open data about the 2011-2016 car crashes reported to the police come from the province of Québec’s open data portal.
The data dictionary is also available on-line.