This Notebook builds on the poll_final sf dataframe we built in the first part of this project. poll_final contains the poll results by party and the geometry for each poll for the 2015 Federal Elections of 2015.
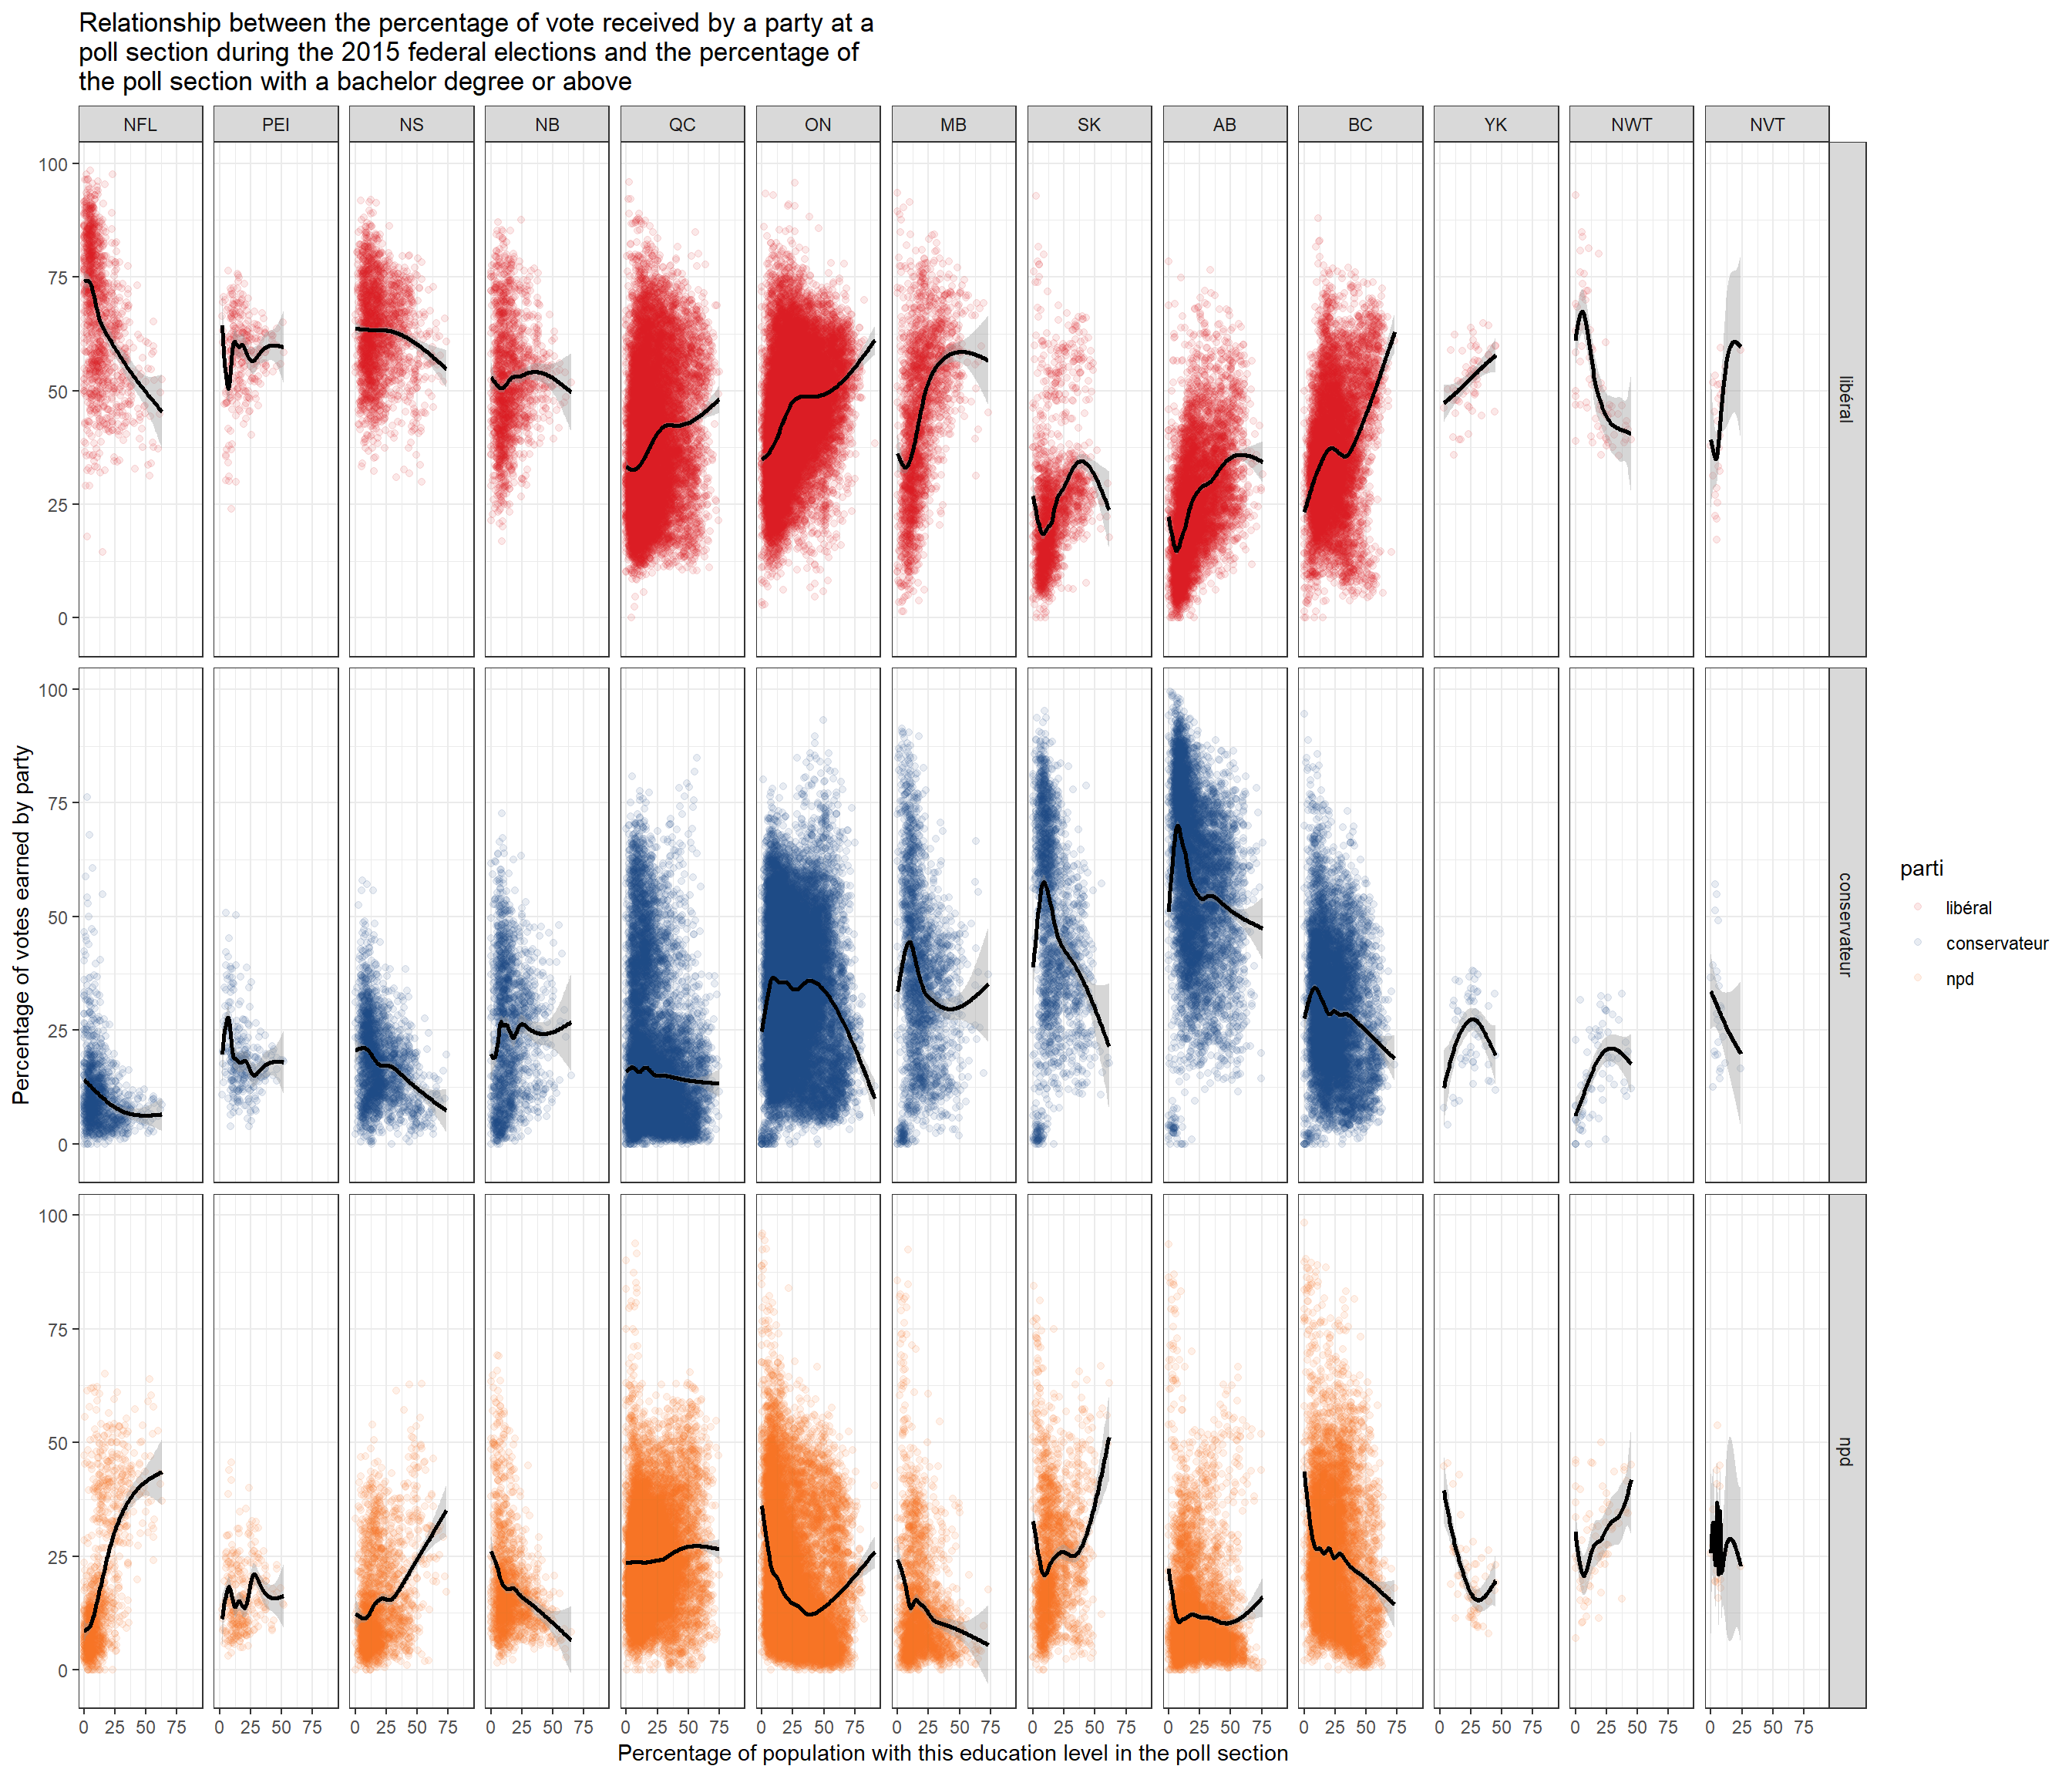
We will use the cancensus package to download sociodemographic data and geometry from the 2016 Canadian Census. We will then “dispatch” the population characteristics to each poll sections and plot the relationship between education and the results of the three main parties (libéral, conservateur and ndp).
Intro The goal of this project is to study how the voting patterns in the 42nd Canadian General Election of 2015 was influenced by socioeconomic characteristics of voters at the poll level.
The project will be split in two (lengthy) posts.
In the first post, we will clean the election results and the election shapefiles and create a map of the results. Our goal is to create a sfdata frame that will allow us to recreate this interactive map by CBC.
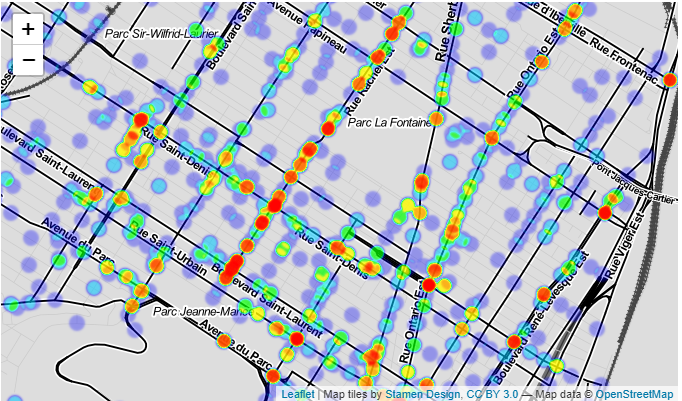
Objective In this project, we will geocode the crash data to identify the spots where the accidents involving bikes in province. This will allow us to determine in which areas an intervention to reduce the risk to active transportation would be most useful.
Data sources Open data about the 2011-2016 car crashes reported to the police come from the province of Québec’s open data portal.
The data dictionary is also available on-line.