Hey,
I’ve finally found an excuse to use the gganimate package in R to generate bar chart races! I’m going back to one of my previous jobs, demography, and we are going to look at how the fertility of the cohorts of Quebec women born between 1915 and 1980 has evolved.
The data Fertility data from Statistics Canada, year 1921-2016.
It includes data for all provinces. The code As usual, the code is on my github.
I just got a speeding ticket by the mail. I’m pissed off, mostly at myself.
Yet, I now have two questions regarding the relevance and efficiency of photo radars:
Relevance: Are photo radars optimally located in areas with lots of crashes? Efficiency: Do photo radars reduce crash frequency? Let’s figure this out by look at some #opendata from Montreal.
Disclaimer: I am not a domain expert, I didnt even bother to do a litterature review.
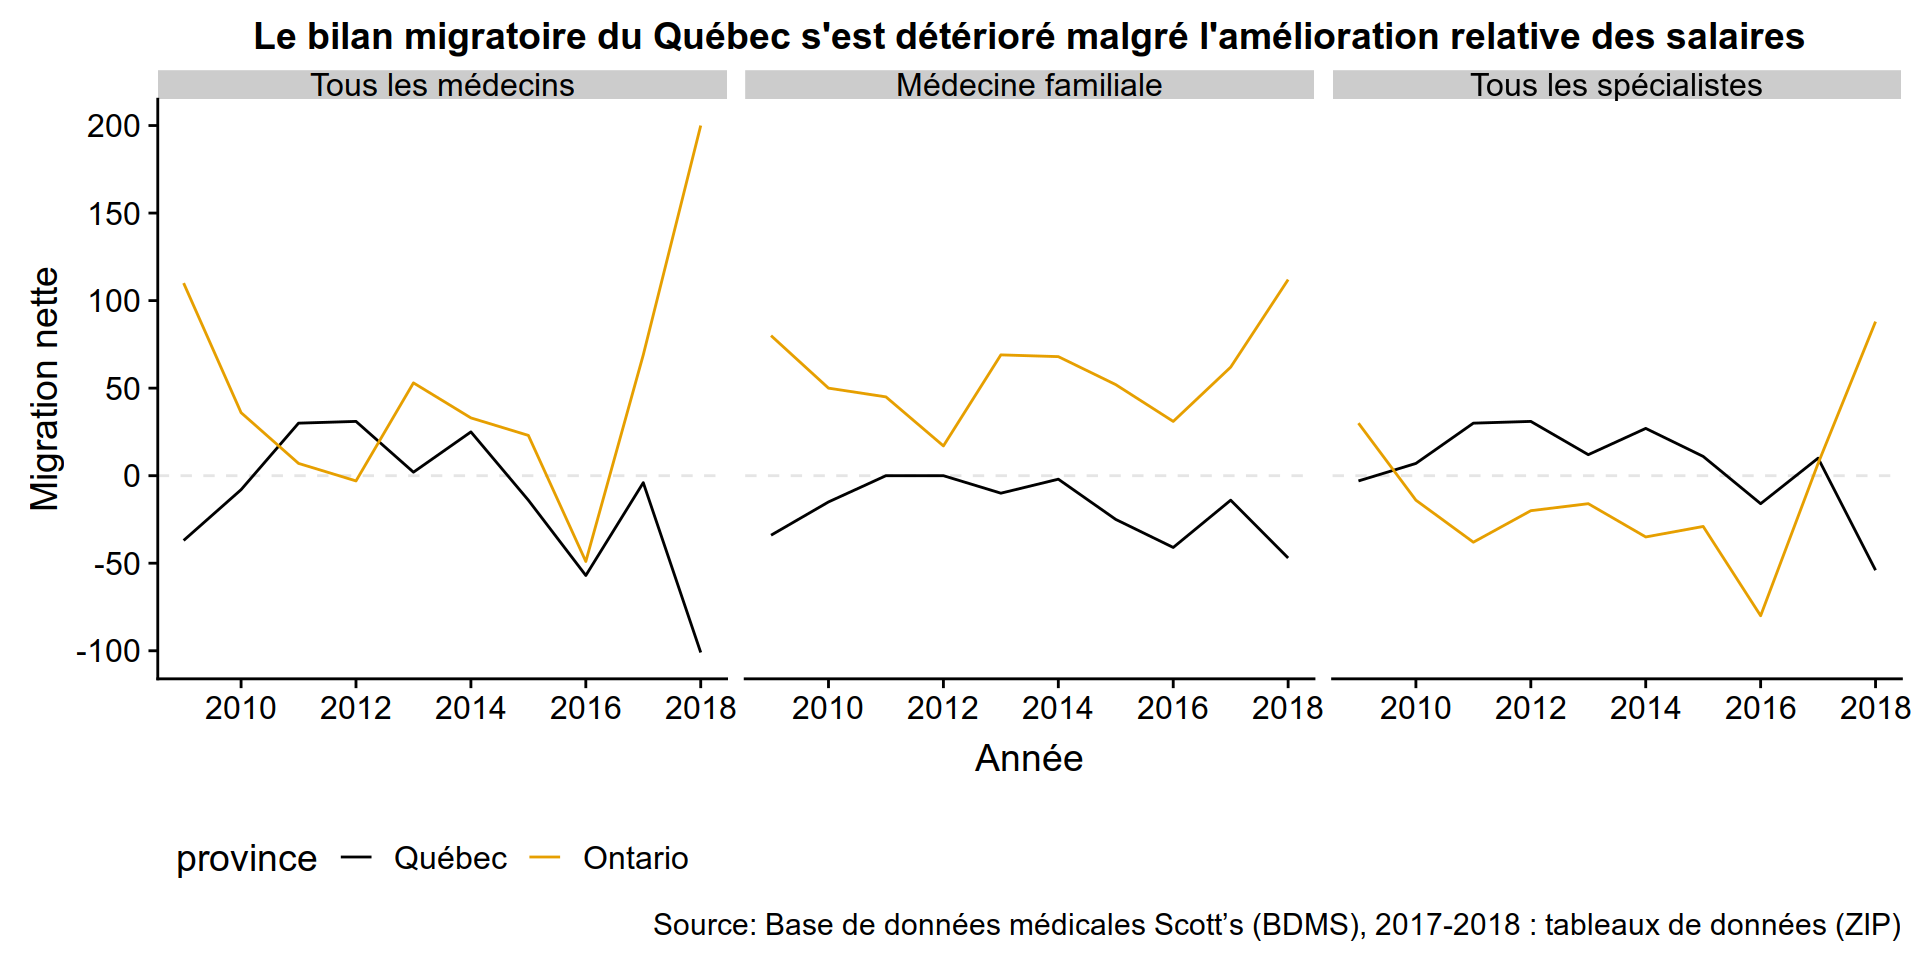
Dre Diane Francoeur, la présidente de la Fédération des médecins spécialistes du Québec a récemment agité l’épouvantail de l’exode des médecins spécialistes comme argument contre le projet de la CAQ de réduire la rémunération des médecins spécialistes du Québec.
Ça m’a mis de mauvaise humeur. Je vous un grand respect pour les médecins, mais leurs représentants ont la fâcheuse manie de dire n’importe quoi. Si un écart salarial de 9 % était suffisant pour générer de grands flux migratoires, les régions du Québec seraient déjà désertes.
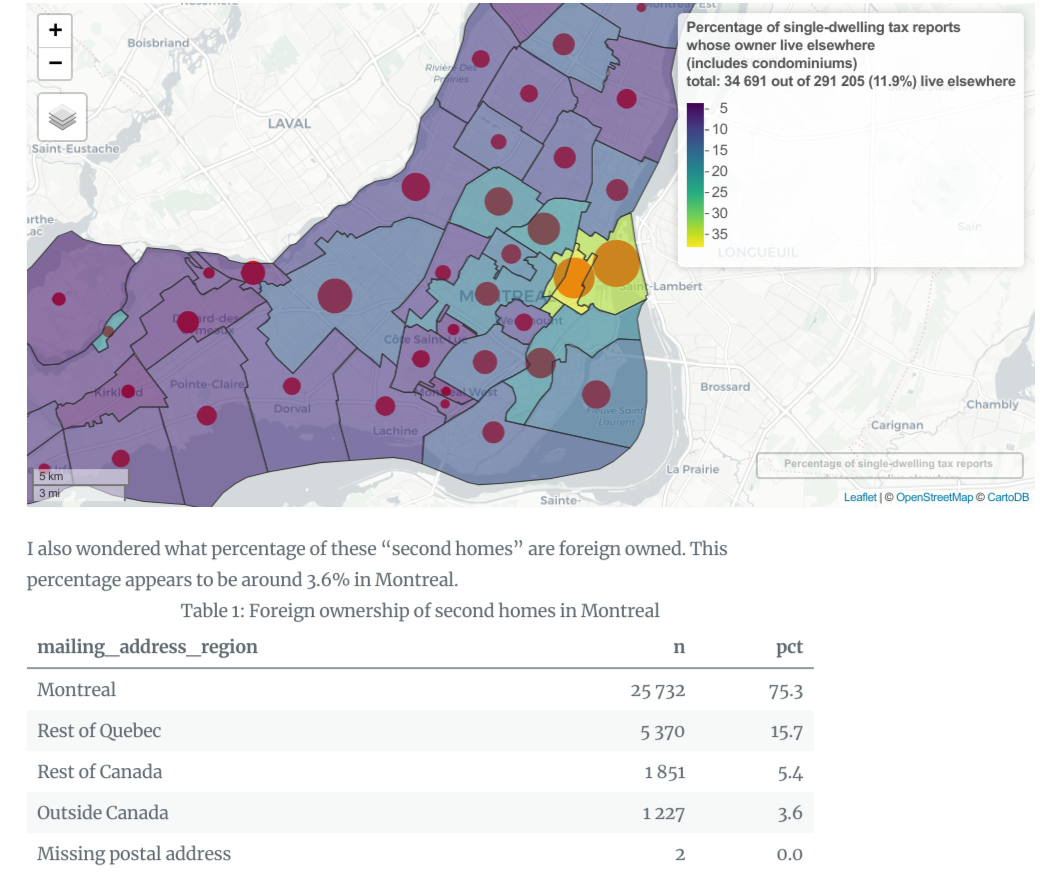
There is a lot of talk in Canada about foreign speculators buying houses and appartments in Canadian cities such as Vancouver and Toronto. It mostly relies on hearsay as there is a huge lack of actual data. I have been wondering what the situation looks like in Montreal.
In this blog post, we will focus on properties that only include 1 dwelling on the tax roll. My understanding is this includes houses and condominiums where each appartment belongs to a separate person, but excludes duplexes and triplexes where a single person owns all appartments.
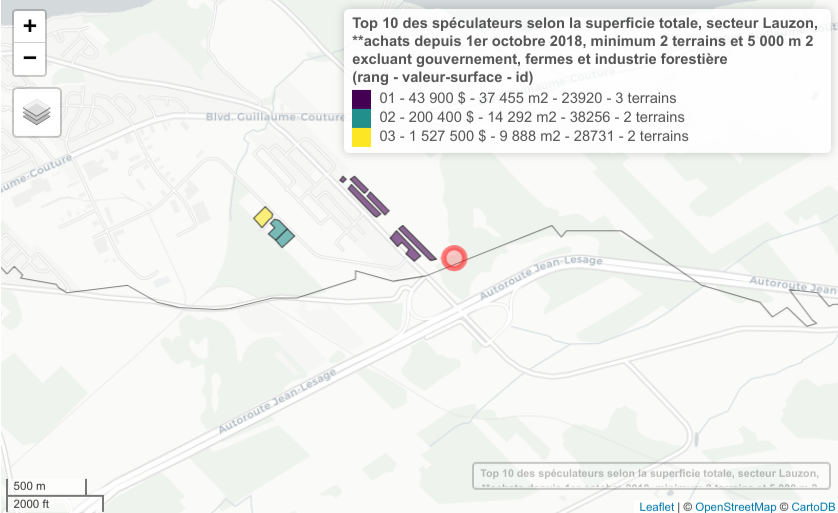
Gilles Lehouillier a déjà dit que “Les études de circulation nous démontrent hors de tout doute que ce ne serait pas justifié d’investir environ 1,5 milliard de dollars pour un tunnel à l’est” Le Soleil, 29 novembre 2011. Le prix du projet a explosé depuis, mais on attend toujours les études de circulations qui l’ont fait changer d’idée.
Je me suis donc demandé à qui profiterait ce fameux troisième lien.
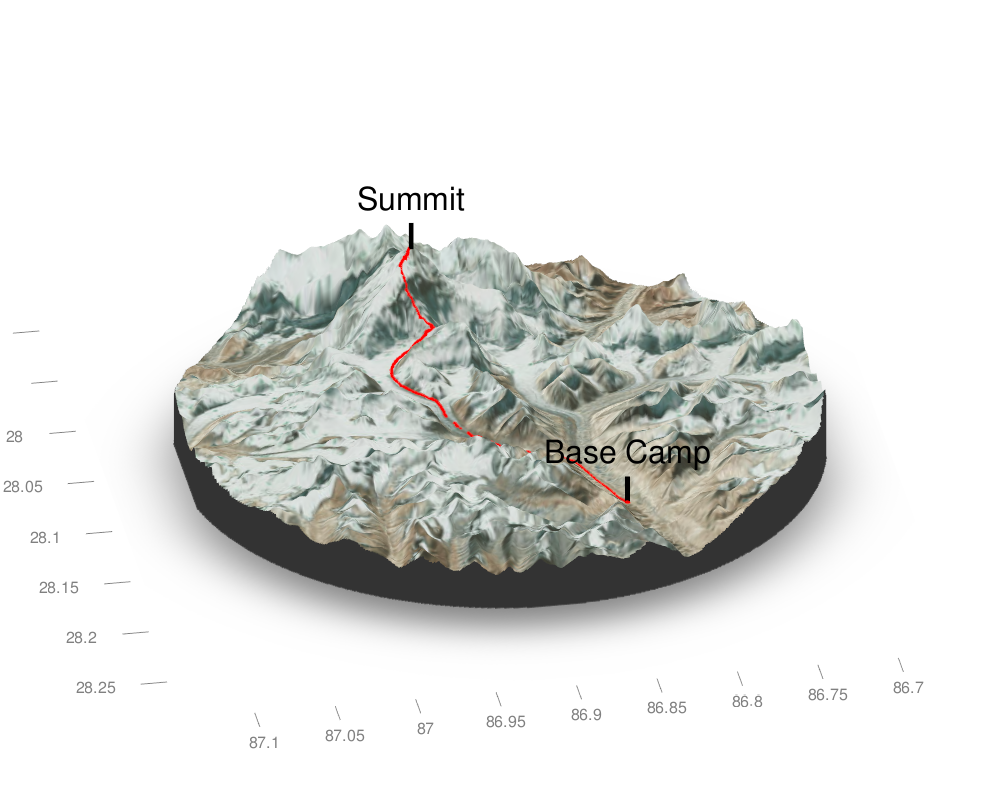
I have been meaning to use Tyler Morgan-Wall rayshader package for a while, but it was only this week that I found an idea: I want to know what the ascent of the Everest summit looks like (topographically).
So I found a GPS track that Kilian Jornet posted on movescounts.com and had a go.
The steps are as follow:
Import the GPS tracks into R using sf::st_read() by Edzer Pebesma
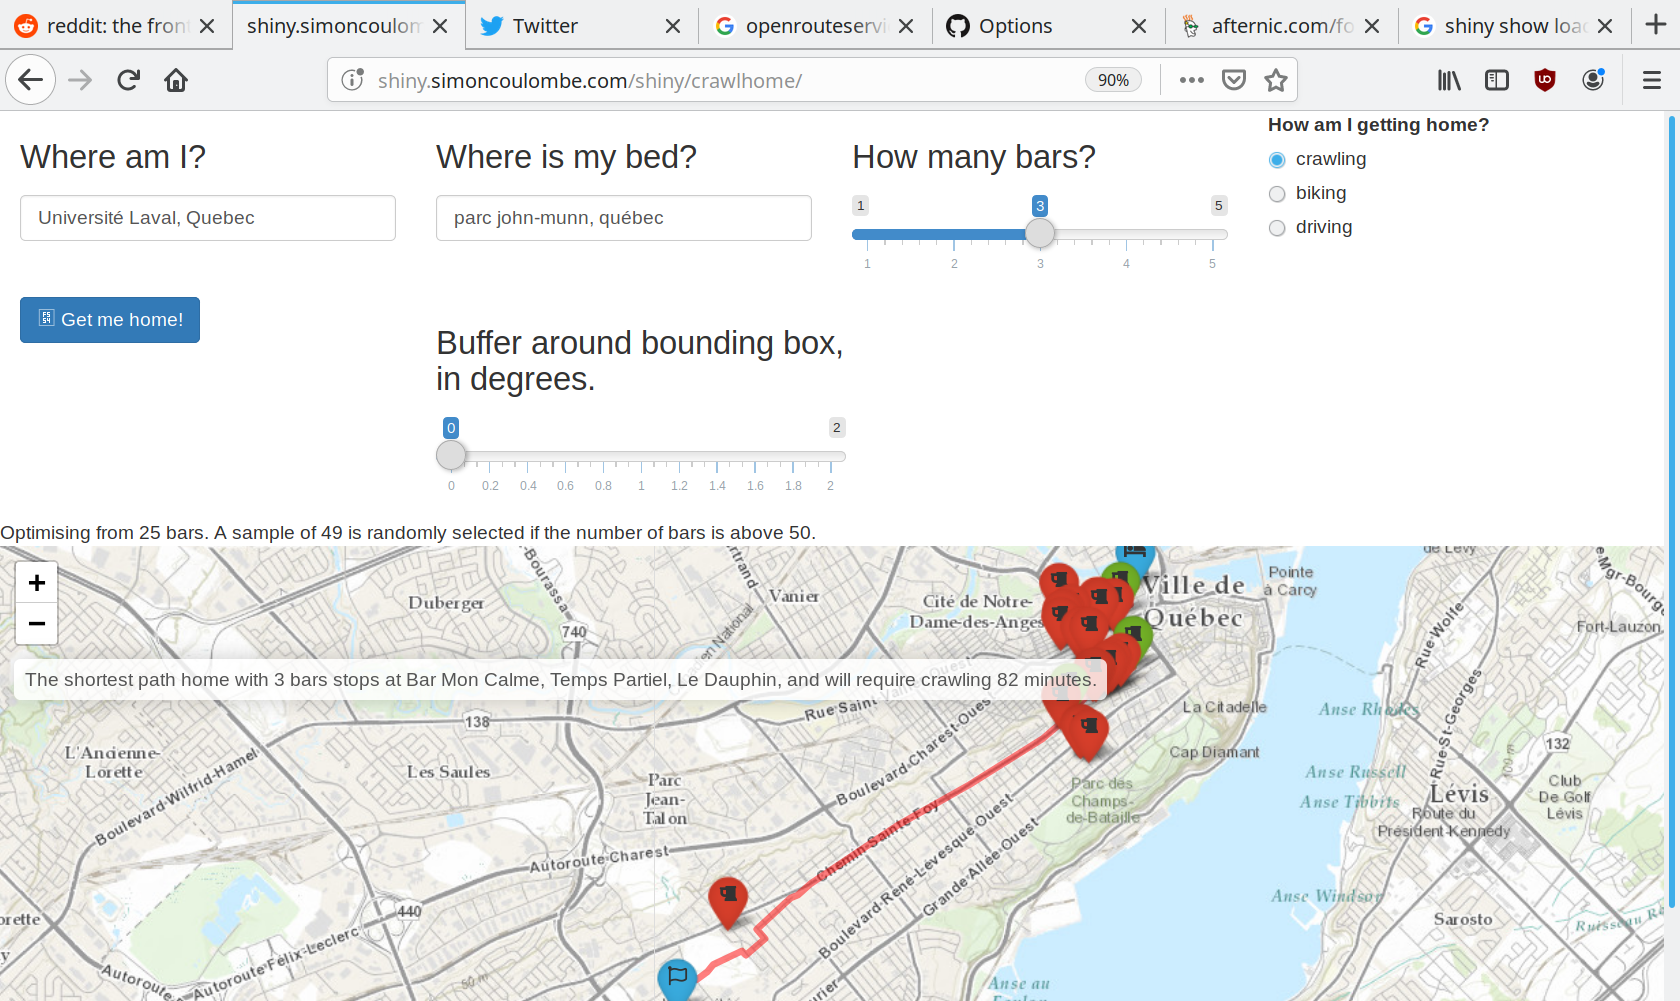
Drunks of the world rejoice, for today a centuries-old problem has been solved. I have created an app that will tell you the shortest path to your bed while stopping at N bars on the way. You can select you mode of transportation: walking, biking or driving.
Try it today by visiting my server at http://shiny.simoncoulombe.com/shiny/crawlhome/ using username guestand password room. Clicking “get me home” will have you hang for about 10 seconds before showing the map.