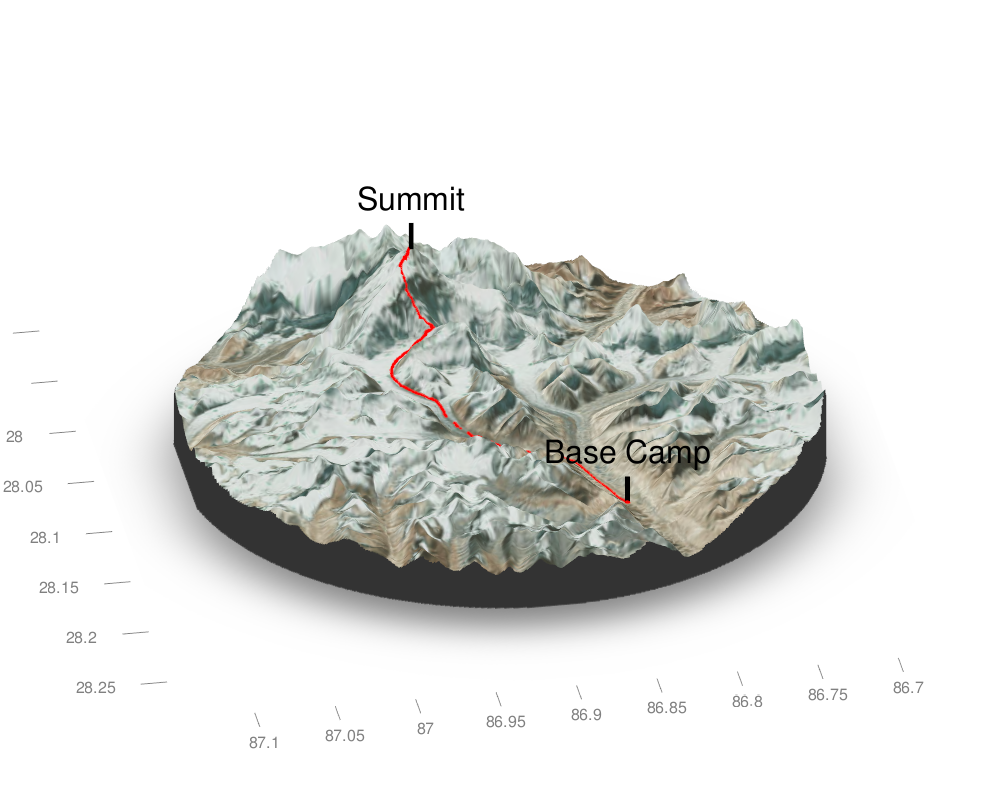
I have been meaning to use Tyler Morgan-Wall rayshader package for a while, but it was only this week that I found an idea: I want to know what the ascent of the Everest summit looks like (topographically). So I found a GPS track that Kilian Jornet posted on movescounts.com and had a go. The steps are as follow: Import the GPS tracks into R using sf::st_read() by Edzer Pebesma

Continue reading

Hey everyone, We all know that the good old plus/minus is flawed. Most notably, it doesn’t take into account the quality of your teammates or that of the opposition. So here is my idea: why not use a Poisson regression? The Poisson regression is a special type of regression where the response variable is a count. For example, ecologists will model the number of fish in samples of a lake of varying volume, accounting for different characteristics of that volume, and actuaries will model the number of claims someone will make during a car insurance policy of varying duration accounting for different characteristics of the driver.

Continue reading

Crawl Home App

Drunks of the world rejoice, for today a centuries-old problem has been solved. I have created an app that will tell you the shortest path to your bed while stopping at N bars on the way. You can select you mode of transportation: walking, biking or driving. Try it today by visiting my server at http://shiny.simoncoulombe.com/shiny/crawlhome/ using username guestand password room. Clicking “get me home” will have you hang for about 10 seconds before showing the map.

Continue reading

La SAAQ publie les rapports d’accidents remplis par les policiers en format de données ouvertes. J’ai utilisé les données de 2011 à 2017pour identifier les endroits les plus accidentogènes pour les piétons et les vélos. Avec un peu de chance ce post permettra à un planificateurs de corriger un des endroits les plus dangereux. Les données comportent environ 700 000 accidents déclarés aux policiers, dont 32 642 impliquant un piéton ou un cycliste.

Continue reading

La neuvième enquête origine-destination de la région de Québec s’est déroulée du 6 septembre au 12 décembre 2017. Elle a été réalisée par un partenariat regroupant le Ministère, le Réseau de transport de la Capitale (RTC), la Société de transport de Lévis, la Ville de Québec, la Ville de Lévis, ainsi que la Communauté métropolitaine de Québec. Le ministre calcule que 40 % des déplacements interrives se font d’est en est, contre 60 % d’ouest en ouest.

Continue reading

UPDATE 2020: addr.country, n’existe plus dans les buildings de osm data. aussi il faut faire st_collection_extract(type=“POLYGON”) car mes intersections ont commencé à retourner des geometry collection This morning I heard an annoucement from the provincial government telling me that preparing for floods is my responsibility, that I should check if my house is in a floodable area and that I should visit quebec.ca/inondations for more information. We currently have multiple major flooding events in the city of Gatineau.

Continue reading

A recent by Arthur Charpentier (@freakonometrics) has inspired me to finally give Jens von Bergmann’s (@vb_jens) dotdensity package a run. I will come back to this code for some examples of how to use dotdensity but also for rmapzen road and water tiles. At first glance, it appears that the immigrants in Montréal from France, Italy, China and Lebanon won’t run into each other very often. Immigrants from Haiti and Algeria and Morocco and both more likely to be found in the North of the island.

Continue reading

Author's picture

Simon Coulombe

gosseux de données | pelleteux de cloud

data scientist in the insurance industry

Québec, Canada